Fig. 2
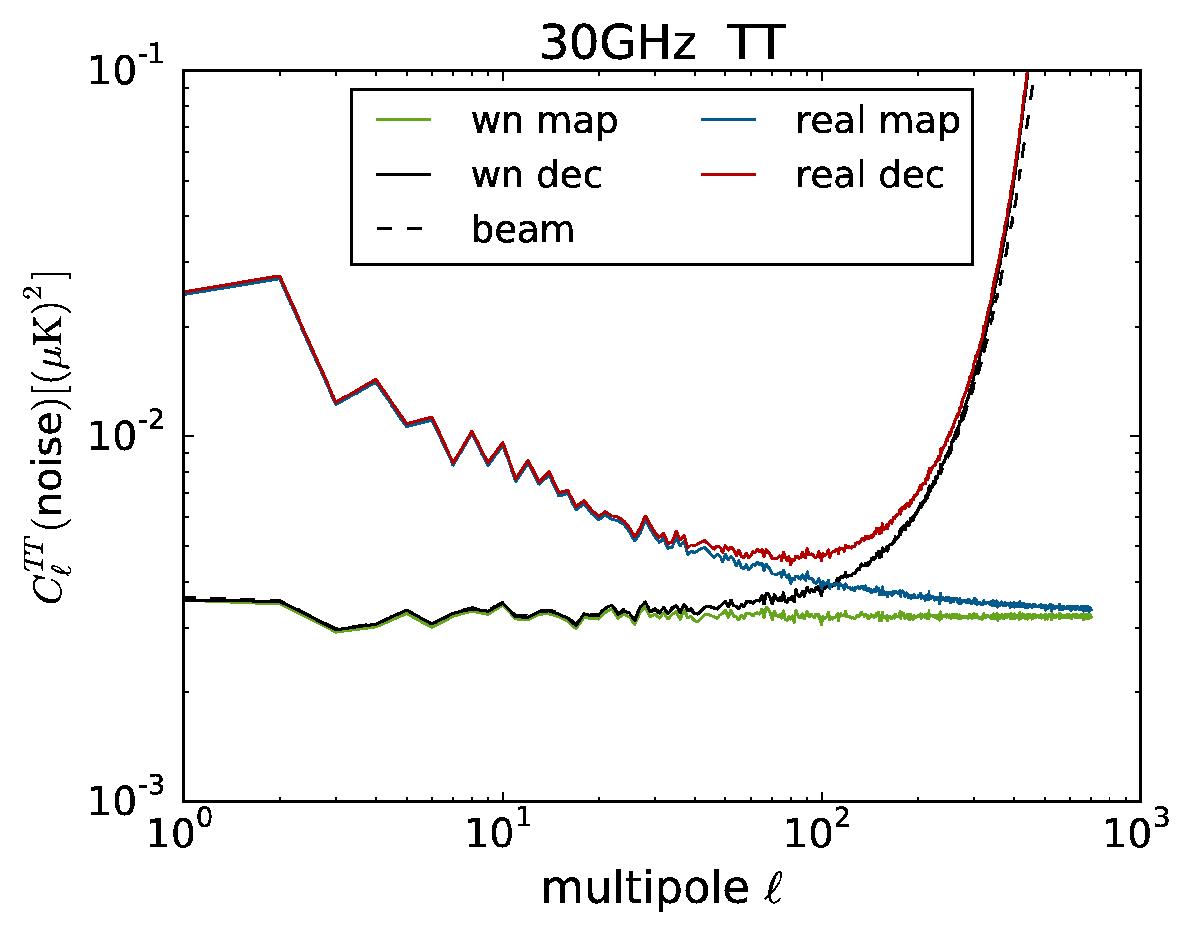
TT spectrum at 30 GHz. We show the deconvolved spectrum and map spectrum for white noise and realistic noise simulations. The spectra are averaged over 40 noise realizations to reduce scatter. Unsmoothed deconvolved spectra rise towards high multipoles, roughly as proportional to the square of the inverse window function. The dashed line shows the uniform white noise spectrum divided by the squared beam window.
Current usage metrics show cumulative count of Article Views (full-text article views including HTML views, PDF and ePub downloads, according to the available data) and Abstracts Views on Vision4Press platform.
Data correspond to usage on the plateform after 2015. The current usage metrics is available 48-96 hours after online publication and is updated daily on week days.
Initial download of the metrics may take a while.