Fig. 18
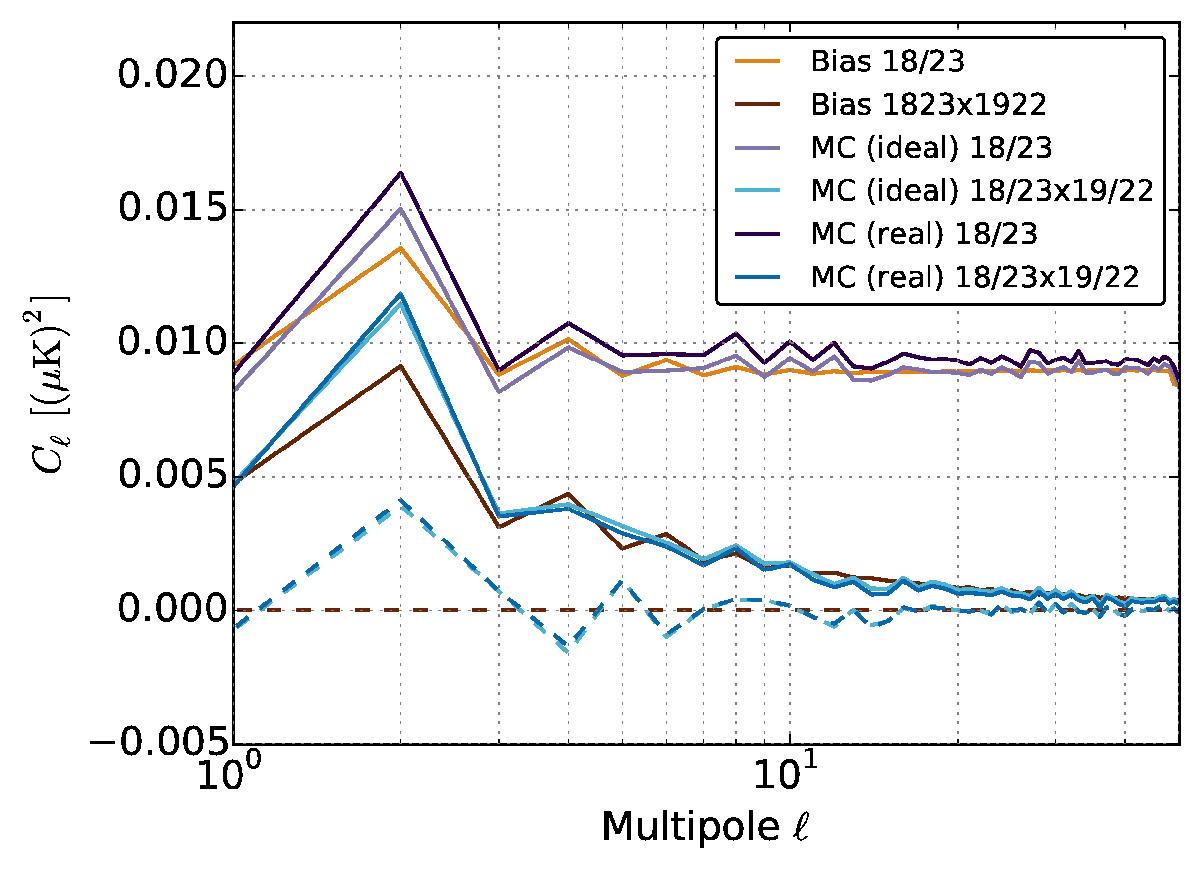
TT spectrum for 18/23 and 19/23 (70 GHz) data sets. Each group of three lines shows a comparison between MC simulations and corresponding NCVM prediction, The NCVM prediction is shown in orange or brown, the MC results in blueish colours. The topmost group shows the auto spectrum of 18/23 (blow-up of Fig. 17). The group in the middle is the cross-spectrum between 18/23 and 19/22, for full destriping. The group shown in dashed line type shows the cross-spectra for independent destriping.
Current usage metrics show cumulative count of Article Views (full-text article views including HTML views, PDF and ePub downloads, according to the available data) and Abstracts Views on Vision4Press platform.
Data correspond to usage on the plateform after 2015. The current usage metrics is available 48-96 hours after online publication and is updated daily on week days.
Initial download of the metrics may take a while.