| Issue |
A&A
Volume 587, March 2016
|
|
|---|---|---|
| Article Number | A22 | |
| Number of page(s) | 5 | |
| Section | Stellar structure and evolution | |
| DOI | https://doi.org/10.1051/0004-6361/201526414 | |
| Published online | 11 February 2016 | |
Research Note
Spectroscopy of close visual binary components of the stable shell star 1 Delphini ⋆,⋆⋆
1
Astronomický ústav, Akademie věd České republiky,
251 65
Ondřejov, Czech
Republic
e-mail: This email address is being protected from spambots. You need JavaScript enabled to view it.
2
Matematički Institut SANU, Kneza Mihaila 36, 11001
Beograd,
Serbia
3
Ústav teoretické fyziky a astrofyziky PřF MU,
Kotlářská 2, 611 37
Brno, Czech
Republic
4
Institute of Astronomy, Bulgarian Academy of
Sciences, 72 Tsarigradsko Shossee
Blvd., 1784
Sofia,
Bulgaria
Received: 26 April 2015
Accepted: 3 December 2015
Abstract
Stable shell stars are ideal objects for studying basic physical principles of the formation of disks in Be stars. If these stars have a close unresolved visual companion, its contribution toward the modelling of the disk cannot be overlooked, as is sometimes done. The study aims to spectroscopically resolve close visual binary Be (shell) star 1 Del, which up to now was only resolved by speckle or micrometric measurements. The integral field spectroscopy obtained by the SINFONI spectrograph at the VLT telescope in the European Southern Observatory (ESO) in the infrared region was used; we supplemented these observations with visual spectroscopy with the Perek Telescope at the Ondřejov Observatory. Spectra of 1 Del were successfully resolved, and, for the first time, spectra of 1 Del B were obtained. We found that 1 Del A is a Be/shell star, while 1 Del B is not an emission-line object.
Key words: stars: emission-line, Be / binaries: visual / infrared: stars / stars: individual: 1 Del
Based on observations collected with the Perek 2-m Telescope at the Ondřejov Observatory, Czech Republic and the SINFONI spectrograph at UT4-Yepun in ESO during the observing programme 093.D-0172.
The reduced spectra as FITS files are only available at the CDS via anonymous ftp to cdsarc.u-strasbg.fr (130.79.128.5) or via http://cdsarc.u-strasbg.fr/viz-bin/qcat?J/A+A/587/A22
© ESO, 2016
1. Introduction
Be stars form an important subgroup of stars of spectral class B. They are defined as non-supergiant B-type stars, which exhibit, or at some time in their observational history have exhibited, emission superimposed over absorption lines in their spectra (Collins 1987). This emission is most commonly found in the Hα line of the Balmer series of hydrogen. Shell stars form a subclass of Be stars (see e.g. Hanuschik 1996). They are characterized by sharp absorption cores of rotationally broadened emission lines. These stars are often variable, for example the star Pleione (see Nemravová et al. 2010). Stable shell stars form their special subclass (see Gulliver 1981). Their stability makes them especially suitable for testing basic physical processes that may lead to the existence of a disk, since the time dependent phenomena do not complicate the analysis. An understanding of stable shell stars may shed light on Be and shell stars with much more complex and time dependent behaviour. For recent reviews about Be stars and their models, see Porter & Rivinius (2003) and Rivinius et al. (2013).
The importance of stable emission-line stars for developing basic physical models of emission formation was already noticed by Marlborough & Cowley (1974), who used the stable shell star 1 Del as a typical stable emission-line star for modelling. More sophisticated models were later calculated by Millar & Marlborough (1999) and Jones et al. (2004). These authors were able to reproduce the profiles of the observed Hα line profile of 1 Del with their model of the circumstellar envelope. They assumed that 1 Del is a single star.
However, 1 Del was discovered as a visual binary with components separated by less than one arcsecond (Burnham 1873a). Also, many other Be stars are in close visual binaries (see Oudmaijer & Parr 2010). Spectroscopic observations of these close visual binaries is not an easy task, since many times the observing conditions are not perfect and light from both stars overlaps. The small separation of the components of the close pair very often causes these stars to appear at the spectrograph slit as a single object. As a consequence, it is difficult or impossible to resolve individual spectra. Observed spectra contain mixed light from both stars. If the magnitude difference between components is not large, both stars significantly contribute to observed spectra and this fact has to be taken into account in analysis using single star disk models. In this paper, we aim to extract spectra of individual components of 1 Del.
2. Summary of basic facts about the star 1 Del
The star 1 Del (HR 7836, HD 195325, BD +10°4303, HIP 101160) belongs to the category of above mentioned stable emission-line shell stars in close visual binaries.
The shell spectrum of 1 Del was first detected on 9 August 1919 at the Dominion Astrophysical Observatory (see Bidelman 1988). Numerous emission lines were reported by Harper (1937, observations from 1929) and Bidelman (1949). Bidelman also noted that the primary component of the visual binary is a shell star. The star 1 Del is also listed by Merrill & Burwell (1949, MWC 1019) as an emission-line star. This star is classified as stable, since no change of its spectrum was recorded between 1953 and 1980 (see Gulliver 1981). Variability found by Abt (2008) and Iliev & Kubát (2013) is very small. Several authors determined the spectral type of 1 Del, which varies between B8 and A1, the most recent determination is A1:III shell (Abt & Morrell 1995).
1 Del is a triple visual system (ADS 13920, CCDM J20303+1054). Burnham (1873b) reported this star as a hardly observable visual binary. His measurements were published in Burnham (1873a) as star No.63 (now denoted as BU 63). Later Burnham (1874) found a faint companion to this binary (star No.297, BU 297). This and later position measurements of components of 1 Del are listed in Table A.1. To summarize, this triple visual system consists of a close visual binary, 1 Del A (V = 6.1) plus 1 Del B (V = 8.1), separated by 0.9″, and a more distant fainter star BD +10°4303 C (V = 14.1, ρ = 16.8″). These values of magnitudes, separation, and angle are taken from Dommanget & Nys (2000).
3. Observations and data reduction
3.1. Ondřejov visual spectra
Visual spectra were observed with the Perek 2-m telescope at the Ondřejov Observatory (Czech Republic) with the slit spectrograph in coudé focus (for description, see Šlechta & Škoda 2002). We obtained medium-resolution spectra, (R ~ 13 000) with the 700-mm spectrograph focus, in which the SITe CCD 2030 × 800 chip of 15 μm pixels was used. Our spectra of 1 Del were taken on 16 September 2007. The data were reduced (bias subtracted, flat-fielded, and wavelength calibrated) using the Image Reduction and Analysis Facility (IRAF1). The spectra were normalized to continuum with a straight line to fit the far wings of the Hα line.
3.2. Infrared SINFONI spectra
The observations were obtained in service mode at the VLT-UT4 (Yepun) telescope at ESO under Programme-ID 093.D-0172(A) during two nights (6 and 10 June 2014). Spectroscopy of 1 Del was carried out with the SINFONI, the AO-assisted integral field spectrograph (Eisenhauer et al. 2003; Bonnet et al. 2004) in all available near-infrared bands (J, H, and K).
The integral field unit of the SINFONI spectrograph divides the field of view to surface elements (usually referred to as “spaxels”). The spatial scale was set to 0.1″ (“spaxel” scale of 50 mas × 100 mas) per pixel with the field of view of 3″ × 3″. Calibrations (dark frames, flatfield frames, and the telluric standard star) were provided by the ESO baseline calibration. The image was rotated using position data from Table A.1 to make the line connecting the close components parallel with the boundary of the field of view. During observations the seeing was between 0.6″ and 2.7″.
We reduced the raw data via the SINFONI pipeline version 2.4.0. Standard reduction steps were taken to the final product of 3D datacubes with one spectral and two spatials dimensions. We used the programme QFitsView 2 for visualization of 3D spectra in image cubes and spectrum extraction. The extracted spectra were normalized to continuum with a straight line.
4. Identification of binary components
4.1. Test of close binary visual spectra
Obtaining spectra of individual components of a visual binary when images of the stars overlap is a challenging task. Consequently, the observed spectrum contains spectra of both components. This is also the case of observations at the Ondřejov Observatory, where even the best seeing conditions are of the order of arcseconds, thus, larger than the apparent separation of the visual components of both binaries. They appear only as one object on a spectrograph slit.
Nevertheless, we carried out the following experiment with the binary 1 Del. Since the Perek 2-m telescope is not equipped with the derotator, the right moment when the connecting line between the A and B components was roughly perpendicular to the slit had to be chosen. Three spectra in the region of the Hα line were secured, one after another. The 0.2″ wide slit was placed at three different parts of the stellar image at the slit camera, at the left hand side (L), right hand side (R), and at the centre (C) of the stellar image. All three exposures were 900 s long. The raw signal was highest for C as expected, but the raw signal for R was about seven times fainter than for L. This means that the fainter component (1 Del B) was located at or near L at the time of observation.
Normalized spectra for C, R, and L are shown at the upper panel of Fig. 1. The emission height with respect to the local continuum is smaller for L than for R. This corresponds to the case when additional continuum (without an emission) is added to the radiation of the star, and the emission strength weakens. All this indicates that the Hα emission should come from the brighter component, namely 1 Del A, rather than from the fainter component, 1 Del B. In the difference spectrum C−L (see the lower panel of Fig. 1), the emission in the Hα line is stronger than in the C spectrum. This shows that the spectrum of 1 Del A is an emission spectrum and that the spectrum of 1 Del B is either an absorption spectrum or it has a weak emission, which appears in the difference spectrum (C−R). However, these observations involve strong uncertainties (mainly because of uncertain positions of components A and B during observations), thus, it is not possible to reach a firm conclusion. To obtain more information about the system, we decided to observe the binaries with an integral field spectroscopy device, which is available in the infrared spectral region.
4.2. Infrared integral field spectroscopy
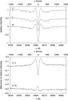 |
Fig. 1 Upper panel: normalized spectra of the Hα line of 1 Del obtained at different places of a stellar image. Spectra were observed one after another during one night. They were obtained by positioning the slit to the left (L), central (C), and right (R) part of the stellar image. In this plot, spectra of (L) and (R) are shifted down by 0.5 and 1.0, respectively. Lower panel: differences between the central (C) spectrum and the left (L) and right (R) spectra. The difference (C−R) is shifted down by 0.5. Velocities in both panels are expressed with respect to the centre of the Hα line. |
The image of the binary 1 Del, obtained by the programme QFitsView from the observations in the J band, is given in Fig. 2. The secondary (1 Del B) is clearly visible in the right part of the image. Stellar spectra were extracted using the programme QFitsView, which enables extraction of spectra for individual spaxels or integrated over a circle of spaxels. The light was integrated from the regions occupied by A and B components with a minimized contribution of the other component. This way we obtained the spectrum of 1 Del A and the very first spectrum of 1 Del B.
The spectra in the region of the Pβ line are plotted in Fig. 3, where the difference between spectra of 1 Del A and 1 Del B is clearly visible. While there is no emission in the Pβ line of 1 Del B, the shell features in the wings of the Pβ line are clearly seen in the spectrum of 1 Del A. Consequently, the A component is a shell star, as indicated by rough estimates from the Hα line profiles. The higher hydrogen Brackett series lines are in the upper panel of Fig. 4. In this region, the absorption in the lines of 1 Del A is sharper, confirming this component as a shell star. The highest members of the Brackett series (above Br17) are hardly seen in the spectrum of 1 Del B, while they are clearly visible for 1 Del A. The strong absorption line near 16 700 Å is caused by a vibrational transition of terrestrial methane (see e.g. Brown et al. 2003), which also causes other surrounding small absorption lines. The strong terrestrial, vibrational absorption of CO2 (see e.g. Rothman et al. 2005; Tashkun et al. 2015) blends with Br13 and Br15 lines. The Brγ line (not shown here) also has emission with a shell absorption core for the A component, however, the spectra in this spectral region are very noisy.
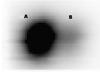 |
Fig. 2 Image of the 1 Del binary obtained by QFitsView in the J band. Both stars are seen clearly. The A component is in the left part of the figure (denoted by the letter A); the B component is in the right part of the figure (denoted by B). |
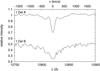 |
Fig. 3 Normalized spectra of A and B components of 1 Del in the region around Pβ line. The spectrum of 1 Del B is shifted down by 0.5. Velocities are expressed with respect to the centre of the Pβ line. |
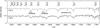 |
Fig. 4 Normalized spectra of A and B components of 1 Del in the region of higher Brackett lines. The spectrum of 1 Del B is shifted down by 0.5. |
To summarize, the observations show that only the A component of 1 Del is an emission-line star. The B component seems to be of a similar spectral type as the A component (without an emission) with significantly broadened absorption lines. By comparing H-band spectra of Be stars presented by Steele & Clark (2001), we may classify 1 Del B as late B. Unfortunately, the H-band region is not suitable for more exact spectral type determination or for rotational velocity determination, since this region lacks uncontaminated photospheric features (cf. Steele & Clark 2001). Nevertheless, we tried to estimate the rotational velocity of 1 Del B from the Br11 line. We applied a technique used, for example by Slettebak (1967), for A-type stars in the visual spectral region, and obtained 370 km s-1, which is a larger value than for 1 Del A. The most recent value by Royer et al. 2002 is 217 km s-1. Since the apparent brightness difference between A and B components is only about 2 magnitudes, then if the components are not resolved, radiation from the B component has to be taken into account in fitting the spectrum of 1 Del.
5. Conclusions
Resolved spectra of both components of the stable shell star 1 Del were obtained for the first time with infrared integral field spectra. We showed that 1 Del A is a shell star, while 1 Del B is not an emission-line star.
IRAF is distributed by the National Optical Astronomy Observatories, which are operated by the Association of Universities for Research in Astronomy, Inc., under cooperative agreement with the National Science Foundation.
Acknowledgments
This research was supported by GA ČR 13-10589S. This research has made use of the Washington Double Star Catalog maintained at the US Naval Observatory. The authors would like to thank the anonymous referee for his/her comments on the manuscript, which led to significant improvement of the paper.
References
- Abt, H. A. 2008, ApJS, 174, 499 [NASA ADS] [CrossRef] [Google Scholar]
- Abt, H. A., & Morrell, N. I. 1995, ApJS, 99, 135 [Google Scholar]
- Alzner, A. 1998, A&AS, 132, 237 [NASA ADS] [CrossRef] [EDP Sciences] [Google Scholar]
- Bidelman, W. P. 1949, PASP, 61, 32 [NASA ADS] [CrossRef] [Google Scholar]
- Bidelman, W. P. 1988, PASP, 100, 1084 [NASA ADS] [CrossRef] [Google Scholar]
- Bonnet, H., Abuter, R., Baker, A., et al. 2004, The ESO Messenger, 117, 17 [Google Scholar]
- Brown, L. R., Benner, D. C., Champion, J. P., et al. 2003, J. Quant. Spec. Radiat. Transf., 82, 219 [Google Scholar]
- Burnham, S. W. 1873a, MNRAS, 33, 351 [NASA ADS] [CrossRef] [Google Scholar]
- Burnham, S. W. 1873b, Astronomical Register, 11, 18 [NASA ADS] [Google Scholar]
- Burnham, S. W. 1874, MNRAS, 35, 31 [NASA ADS] [CrossRef] [Google Scholar]
- Collins, G. 1987, in Physics of Be Stars, eds. A. Slettebak, & T. P. Snow (Cambridge: Cambridge University Press), IAU Colloq., 92, 3 [Google Scholar]
- Docobo, J. A., Andrade, M., Ling, J. F., et al. 2004, AJ, 127, 1181 [NASA ADS] [CrossRef] [Google Scholar]
- Dommanget, J., & Nys, O. 2000, A&A, 363, 991 [NASA ADS] [Google Scholar]
- Douglass, G. G., Mason, B. D., Rafferty, T. J., Holdenried, E. R., & Germain, M. E. 2000, AJ, 119, 3071 [NASA ADS] [CrossRef] [Google Scholar]
- Eisenhauer, F., Abuter, R., Bickert, K., et al. 2003, in Instrument Design and Performance for Optical/Infrared Ground-based Telescopes, eds. M. Iye, & A. F. M. Moorwood, SPIE Conf. Ser., 4841, 1548 [Google Scholar]
- ESA 1997, The Hipparcos and Tycho catalogues, ESA SP, 1200 [Google Scholar]
- Fabricius, C., & Makarov, V. V. 2000, A&A, 356, 141 [NASA ADS] [Google Scholar]
- Gulliver, A. F. 1981, ApJ, 248, 222 [NASA ADS] [CrossRef] [Google Scholar]
- Hanuschik, R. W. 1996, A&A, 308, 170 [NASA ADS] [Google Scholar]
- Harper, W. E. 1937, Publications of the Dominion Astrophysical Observatory Victoria, 7, 1 [Google Scholar]
- Hartkopf, W. I., Mason, B. D., McAlister, H. A., et al. 2000, AJ, 119, 3084 [NASA ADS] [CrossRef] [Google Scholar]
- Hartkopf, W. I., Mason, B. D., Finch, C. T., et al. 2013, AJ, 146, 76 [NASA ADS] [CrossRef] [Google Scholar]
- Heintz, W. D. 1961, J. Observateurs, 44, 158 [NASA ADS] [Google Scholar]
- Iliev, L., & Kubát, J. 2013, Bulgarian Astron. J., 19, 3 [NASA ADS] [Google Scholar]
- Jones, C. E., Sigut, T. A. A., & Marlborough, J. M. 2004, MNRAS, 352, 841 [NASA ADS] [CrossRef] [Google Scholar]
- Marlborough, J. M., & Cowley, A. P. 1974, ApJ, 187, 99 [NASA ADS] [CrossRef] [Google Scholar]
- Mason, B. D., Hartkopf, W. I., Wycoff, G. L., et al. 2004, AJ, 128, 3012 [NASA ADS] [CrossRef] [Google Scholar]
- Merrill, P. W., & Burwell, C. G. 1949, ApJ, 110, 387 [NASA ADS] [CrossRef] [Google Scholar]
- Millar, C. E., & Marlborough, J. M. 1999, ApJ, 516, 280 [NASA ADS] [Google Scholar]
- Nemravová, J., Harmanec, P., Kubát, J., et al. 2010, A&A, 516, A80 [NASA ADS] [CrossRef] [EDP Sciences] [Google Scholar]
- Oudmaijer, R. D., & Parr, A. M. 2010, MNRAS, 405, 2439 [NASA ADS] [Google Scholar]
- Porter, J. M., & Rivinius, T. 2003, PASP, 115, 1153 [NASA ADS] [CrossRef] [Google Scholar]
- Prêtre, P. 1951, J. Observateurs, 34, 25 [NASA ADS] [Google Scholar]
- Rivinius, T., Carciofi, A. C., & Martayan, C. 2013, A&ARv, 21, 69 [Google Scholar]
- Rothman, L. S., Jacquemart, D., Barbe, A., et al. 2005, J. Quant. Spec. Radiat. Transf., 96, 139 [Google Scholar]
- Royer, F., Grenier, S., Baylac, M. O., Gómez, A. E., & Zorec, J. 2002, A&A, 393, 897 [NASA ADS] [CrossRef] [EDP Sciences] [Google Scholar]
- Scardia, M., Prieur, J. L., Pansecchi, L., et al. 2006, MNRAS, 367, 1170 [NASA ADS] [CrossRef] [Google Scholar]
- Šlechta, M., & Škoda, P. 2002, Publ. Astron. Inst. Acad. Sci. Czech Rep., 90, 9 [Google Scholar]
- Slettebak, A. 1967, AJ, 72, 829 [NASA ADS] [CrossRef] [Google Scholar]
- Steele, I. A., & Clark, J. S. 2001, A&A, 371, 643 [NASA ADS] [CrossRef] [EDP Sciences] [Google Scholar]
- Tashkun, S. A., Perevalov, V. I., Gamache, R. R., & Lamouroux, J. 2015, J. Quant. Spec. Radiat. Transf., 152, 45 [Google Scholar]
- van den Bos, W. H. 1958, AJ, 63, 63 [NASA ADS] [CrossRef] [Google Scholar]
- van Herk, G. 1966, J. Observateurs, 49, 355 [NASA ADS] [Google Scholar]
- Wycoff, G. L., Mason, B. D., & Urban, S. E. 2006, AJ, 132, 50 [NASA ADS] [CrossRef] [Google Scholar]
Appendix A: Appendix A
Measurements of angular separation of components of the triple system 1 Del.
All Tables
All Figures
|
Fig. 1 Upper panel: normalized spectra of the Hα line of 1 Del obtained at different places of a stellar image. Spectra were observed one after another during one night. They were obtained by positioning the slit to the left (L), central (C), and right (R) part of the stellar image. In this plot, spectra of (L) and (R) are shifted down by 0.5 and 1.0, respectively. Lower panel: differences between the central (C) spectrum and the left (L) and right (R) spectra. The difference (C−R) is shifted down by 0.5. Velocities in both panels are expressed with respect to the centre of the Hα line. |
| In the text | |
|
Fig. 2 Image of the 1 Del binary obtained by QFitsView in the J band. Both stars are seen clearly. The A component is in the left part of the figure (denoted by the letter A); the B component is in the right part of the figure (denoted by B). |
| In the text | |
|
Fig. 3 Normalized spectra of A and B components of 1 Del in the region around Pβ line. The spectrum of 1 Del B is shifted down by 0.5. Velocities are expressed with respect to the centre of the Pβ line. |
| In the text | |
|
Fig. 4 Normalized spectra of A and B components of 1 Del in the region of higher Brackett lines. The spectrum of 1 Del B is shifted down by 0.5. |
| In the text | |
Current usage metrics show cumulative count of Article Views (full-text article views including HTML views, PDF and ePub downloads, according to the available data) and Abstracts Views on Vision4Press platform.
Data correspond to usage on the plateform after 2015. The current usage metrics is available 48-96 hours after online publication and is updated daily on week days.
Initial download of the metrics may take a while.