Fig. 1
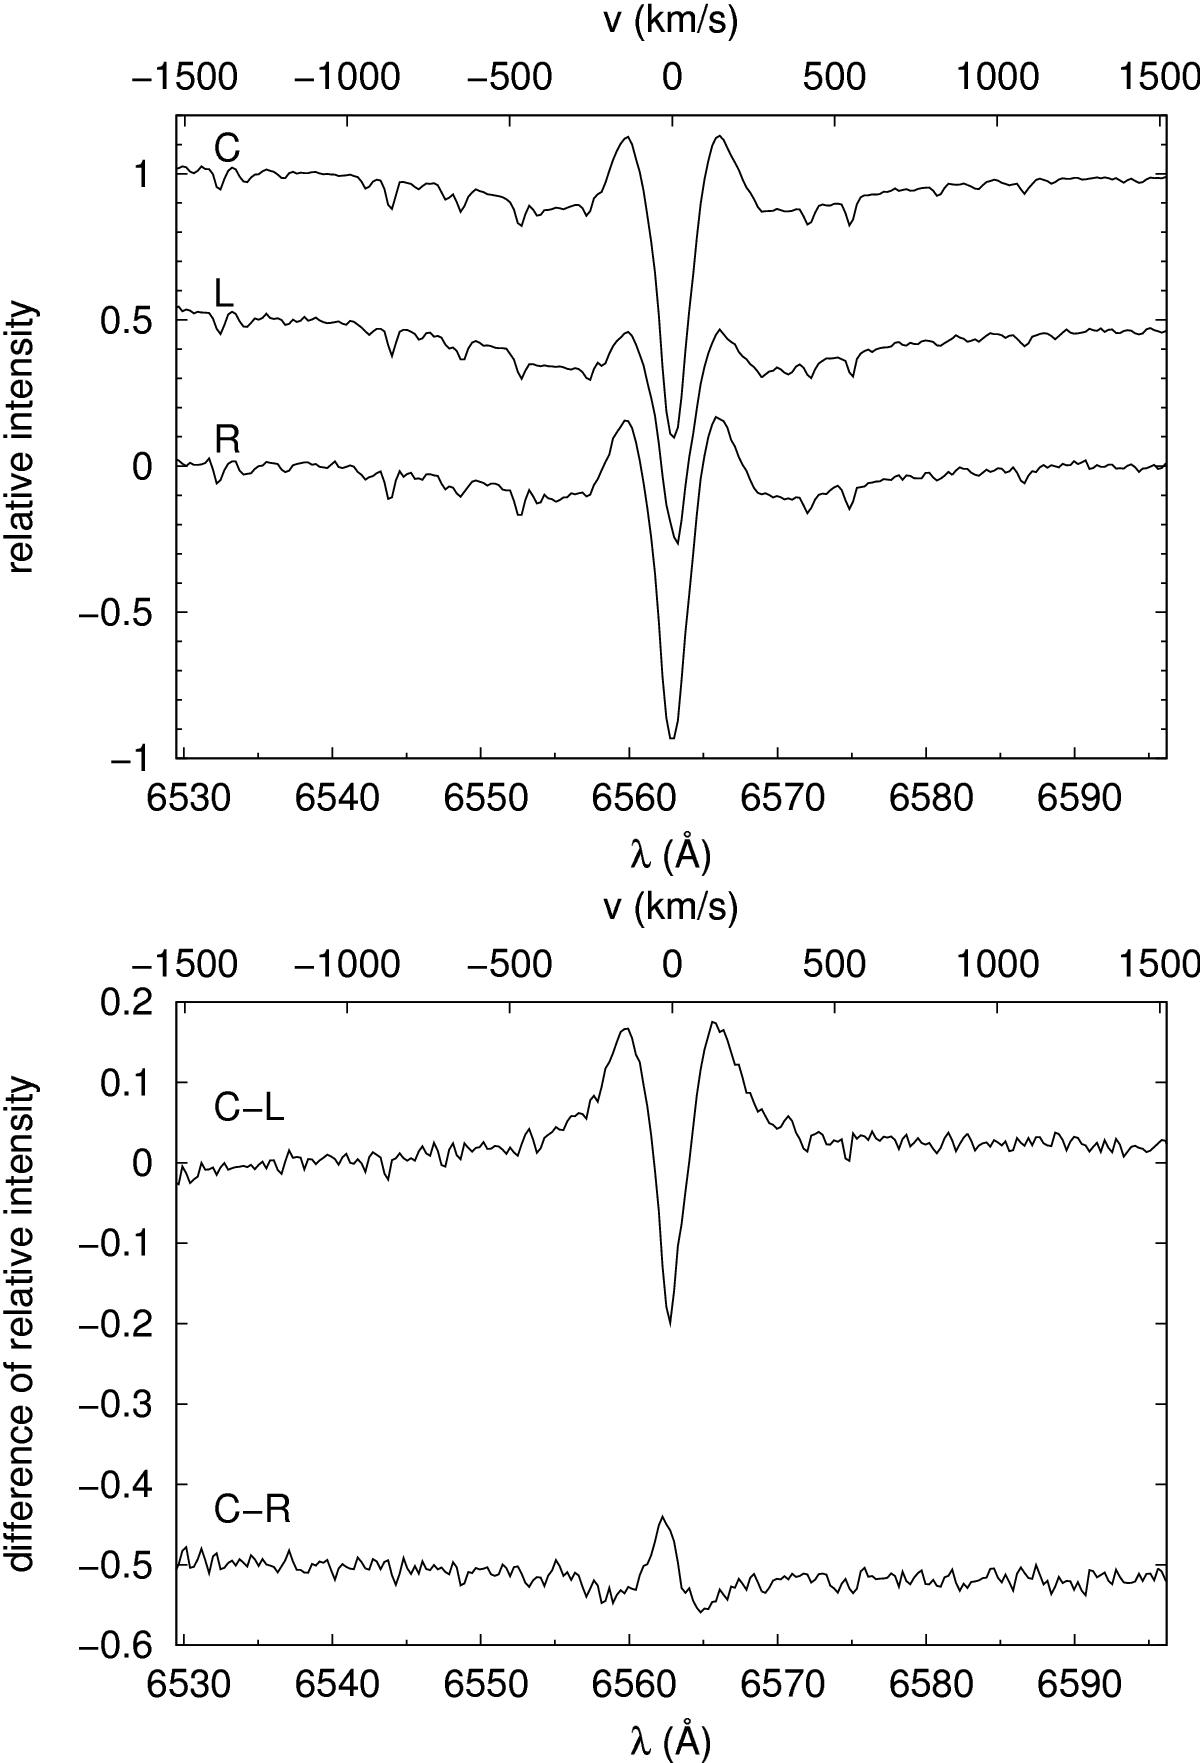
Upper panel: normalized spectra of the Hα line of 1 Del obtained at different places of a stellar image. Spectra were observed one after another during one night. They were obtained by positioning the slit to the left (L), central (C), and right (R) part of the stellar image. In this plot, spectra of (L) and (R) are shifted down by 0.5 and 1.0, respectively. Lower panel: differences between the central (C) spectrum and the left (L) and right (R) spectra. The difference (C−R) is shifted down by 0.5. Velocities in both panels are expressed with respect to the centre of the Hα line.
Current usage metrics show cumulative count of Article Views (full-text article views including HTML views, PDF and ePub downloads, according to the available data) and Abstracts Views on Vision4Press platform.
Data correspond to usage on the plateform after 2015. The current usage metrics is available 48-96 hours after online publication and is updated daily on week days.
Initial download of the metrics may take a while.