| Issue |
A&A
Volume 587, March 2016
|
|
|---|---|---|
| Article Number | A130 | |
| Number of page(s) | 19 | |
| Section | Interstellar and circumstellar matter | |
| DOI | https://doi.org/10.1051/0004-6361/201526198 | |
| Published online | 02 March 2016 | |
The origin of gas-phase HCO and CH3O radicals in prestellar cores⋆,⋆⋆
1 Univ. Grenoble Alpes, IPAG 38000 Grenoble France
2 CNRS , IPAG, 38000 Grenoble, France
e-mail: This email address is being protected from spambots. You need JavaScript enabled to view it.
; This email address is being protected from spambots. You need JavaScript enabled to view it.
Received: 27 March 2015
Accepted: 22 December 2015
Abstract
Context. The recent unexpected detection of terrestrial complex organic molecules in the cold (~10 K) gas has cast doubts on the commonly accepted formation mechanisms of these species. Standard gas-phase mechanisms are inefficient and tend to underproduce these molecules, and many of the key reactions involved are unconstrained. Grain-surface mechanisms, which were presented as a viable alternative, suffer from the fact that they rely on grain surface diffusion of heavy radicals, which is not possible thermally at very low temperatures.
Aims. One of the simplest terrestrial complex organic molecules, methanol is believed to form on cold grain surfaces following from successive H atom additions on CO. Unlike heavier species, H atoms are very mobile on grain surfaces even at 10 K. Intermediate species involved in grain surface methanol formation by CO hydrogenation are the radicals HCO and CH3O, as well as the stable species formaldehyde H2CO. These radicals are thought to be precursors of complex organic molecules on grain surfaces.
Methods. We present new observations of the HCO and CH3O radicals in a sample of prestellar cores and carry out an analysis of the abundances of the species HCO, H2CO, CH3O, and CH3OH, which represent the various stages of grain-surface hydrogenation of CO to CH3OH.
Results. The abundance ratios between the various intermediate species in the hydrogenation reaction of CO on grains are similar in all sources of our sample, HCO:H2CO:CH3O:CH3OH ~10:100:1:100. We argue that these ratios may not be representative of the primordial abundances on the grains but, rather, suggest that the radicals HCO and CH3O are gas-phase products of the precursors H2CO and CH3OH, respectively. Various gas-phase pathways are considered, including neutral-neutral and ion-molecule reactions, and simple estimates of HCO and CH3O abundances are compared to the observations. Critical reaction rate constants, branching ratios, and intermediate species are finally identified.
Key words: astrochemistry / ISM: abundances / ISM: molecules
Based on observations carried out with the IRAM 30 m telescope. IRAM is supported by INSU/CNRS (France), MPG (Germany), and IGN (Spain).
The data and the final FITS cubes are only available at the CDS via anonymous ftp to cdsarc.u-strasbg.fr (130.79.128.5) or via http://cdsarc.u-strasbg.fr/viz-bin/qcat?J/A+A/587/A130
© ESO, 2016
1. Introduction
Complex organic molecules (COMs) have long been detected in the interstellar medium (Gottlieb 1973; Brown et al. 1975; Tucker et al. 1974; Avery et al. 1976) and are known to present a wide variety of species from insaturated carbon chains like C4H or cyanopolyynes to (more) saturated, terrestrial-like O- or N- bearing molecules, such as methyl formate (CH3OCHO) or acetonitrile (CH3CN). If carbon chain molecules were readily found in dark clouds, and their abundances reasonably accounted for by cold gas-phase chemistry (see Loison et al. 2014, for a recent review), terrestrial COMs have until recently been thought to be characteristic of hot cores or hot corinos, where they were found to be abundant using both single-dish and interferometric observations (van Dishoeck et al. 1995; Cazaux et al. 2003; Bottinelli et al. 2004).
For these COMs, the most favoured formation mechanism involve the freezing out of simple atoms and simple molecules like CO onto the dust grains during the prestellar phase, where they can be hydrogenated. After the protostar forms and starts heating up its surroundings, the radicals on the grain mantles, which were either created by UV irradiation of the ices (Garrod & Herbst 2006) or trapped in grain mantles (Taquet et al. 2012), start diffusing on the surface at a temperature of about 30 K. Upon reaction, these radicals can form more complex molecules like methyl formate or dimethyl ether. The synthesised molecules are then thermally evaporated at higher temperatures.
Pure gas-phase formation mechanisms involving the reactions of protonated methanol or protonated formaldehyde with neutrals followed by dissociative recombinations (Charnley et al. 1992) have been shown to lead to COM abundances that are several orders of magnitude lower than those observed, because the formation of complex molecular ions is not energetically favourable (Horn et al. 2004), and dissociative recombinations favour the channels disrupting the molecular ions into small fragments (see Geppert et al. 2006, in the case of methanol). The detections of saturated COMs in a prestellar core at 10 K by Bacmann et al. (2012) or in the cold source B1-b by Cernicharo et al. (2012) have, however, cast doubt on grain surface mechanisms, since the temperature is not high enough to provide radicals with the necessary amount of energy to diffuse on the grains.
A possible source of energy within prestellar cores could be cosmic rays, either directly or indirectly with secondary UV photons, but these remain widely unconstrained, and it is also unclear whether such mechanisms would produce COM amounts consistent with those observed in the gas-phase. Recently, Vasyunin & Herbst (2013) and Balucani et al. (2015) have proposed new gas-phase mechanisms based in particular on radiative association reactions, which are able to account for several COM abundances in prestellar cores (though not for e.g. methyl formate). Alternatively, Ruaud et al. (2015) studied the possibility that COMs form on grain surfaces following the direct chemical reaction of carbon atoms with the ice mantle constituents. However promising, those models rely on poorly constrained physical mechanisms (e.g. chemical desorption: Garrod et al. 2007) and reactions where the rates are very uncertain and should be measured in the laboratory for confirmation. The question of the formation mechanism of COMs at very cold temperatures remains debated and unsettled.
Methanol is one of the simplest terrestrial COMs seen in the interstellar medium. It is widely detected in cold dark clouds and prestellar cores (Friberg et al. 1988; Tafalla et al. 2006), and its formation mechanism is better constrained than that of larger COMs because more experimental data are available. Gas-phase chemistry is believed to be inefficient at forming CH3OH (Garrod et al. 2006; Geppert et al. 2006) and to underestimate observed methanol abundances of 10-9 by several orders of magnitude. These estimates rely partly on the value of the branching ratios of the dissociative recombination of protonated methanol, which was measured experimentally by Geppert et al. (2006) and yields only 3% for  . Grain-surface reactions, on the other hand, provide an alternative way to form methanol in the cold interstellar medium, since CO can be successively hydrogenated on the grains following CO → HCO → H2CO → CH3O → CH3OH (e.g. Brown et al. 1988).
Laboratory experiments carried out at 10 K have confirmed the possibility of synthesising methanol on grain surfaces by injecting H atoms towards a cold CO surface (Watanabe & Kouchi 2002). According to Watanabe & Kouchi (2002) this mechanism is efficient, and as much as 10% of the CO could be converted to CH3OH. The products of this reaction are assumed to be desorbed back to the gas phase by cosmic ray impact or irradiation by secondary UV photons in regions where the temperature is not high enough to warrant evaporation of methanol ices (at ~100 K). The process of methanol formation by multiple hydrogenation of CO is most efficient in very cold gas (10−15 K) because higher temperatures mean that H atoms will not remain on grain surfaces, and CO molecules will also return to the gas phase above 20−30 K. Therefore, it is presently thought that the methanol seen in the hot cores of young low-mass stars has its origin in the prestellar stage.
Intermediate products in this process like HCO and CH3O are of particular interest, since they are believed to be the precursors of saturated COMs in the kind of scenario proposed by Garrod & Herbst (2006), for example. Though the formyl radical HCO was detected nearly 40 yr ago (Snyder et al. 1976), observations in the cold gas are still scarce. Mostly, HCO has been detected in moderate density or photon-dominated regions. Gerin et al. (2009) observed HCO in the PDR of the Horsehead and also at one position in the dense core adjacent to the PDR. Frau et al. (2012) also observed a series of cold starless cores in the Pipe nebula. HCO is seen towards the cores with modest column densities (N ~ 1022 cm-2) but not in the denser (probably prestellar) deuterated cores. The methoxy radical CH3O was only detected recently towards the cold cloud B1-b (Cernicharo et al. 2012), and is so far the only detection of this species in the interstellar medium.
Here, we present observations of the formyl and methoxy radicals, as well as methanol in a sample of prestellar cores, which we supplement with H2CO data from the literature in order to study the intermediate steps towards the formation of CH3OH by successive hydrogenation of CO molecules on cold grain surfaces. The paper is organised as follows. In Sect. 2, we describe the observations, and in Sect. 3 we derive the HCO, CH3O, and CH3OH abundances. In Sect. 4, we discuss chemical routes to form HCO and CH3O, both grain-surface and gas phase, and propose a likely mechanism for their formation in the cold dense gas. Finally, we conclude in Sect. 5.
2. Observations
Our sample is made up of eight sources: L1689B, L1495A-S, L429, L1709A, TMC2, L1521E, L1512, and L1517B. They were chosen in order to sample different star forming regions, and physical and chemical properties. The source properties and coordinates are summed up in Table 1. The sources were observed at the peak of their millimetre continuum emission with the IRAM 30 m telescope, Pico Veleta, Spain, during various observing runs between January 2003 and May 2014 as described below.
Observed sources and their properties.
HCO and CH3O were simultaneously observed at 86.7 GHz and 82.4 GHz, respectively, with the EMIR090 receiver connected to a Fourier Transform Spectrometer (FTS) at the spectral resolution of 50 kHz (corresponding to a velocity resolution of ~0.18 km s-1) in January 2012 for L1689B and June 2012 for the other sources. Several methanol transitions were observed between 2011 and 2014 with the EMIR090 receiver between 80 and 110 GHz and with the EMIR150 receiver between 143.3 and 145.15 GHz, with the 50 kHz FTS as backend. The complete list of transitions is given in Table 2. Since the spectrometer has a large instantaneous bandwidth (a total of 8 GHz can be covered non-contiguously in both polarisations in one frequency setting), many methanol transitions can be observed simultaneously. Nevertheless, only transitions with upper-level energies lower than ~ 40 K were considered, since higher energy transitions of this molecule are not excited at the low temperatures (around 10 K) prevailing in the sources. Similarly, methanol transitions with Einstein coefficients lower than typically 10-7 s-1 are intrinsically very weak. They are not detected in our sources so we do not analyse them in this study. Velocity resolutions ranged from ~0.18 km s-1 towards 80 GHz to about 0.10 km s-1 at 145 GHz. All data were taken in the frequency-switching mode with a frequency throw of 7.5 MHz to reduce standing waves. During the observations, the weather conditions were good with system temperatures close to 150 K at 3 mm and 250 K at 2 mm for the low declination sources and 80 K at 3 mm and 150 K at 2 mm for Taurus sources. Pointing was checked about every 1.5 h on nearby quasars and found to be accurate within 3–4′′ at 3 mm and 2−3′′ at 2 mm. The beam sizes vary from 16′′ at 145 GHz to 26′′ at 96 GHz and 29′′ at 85 GHz. The forward efficiencies were ηfwd = 0.95 at 3 mm and ηfwd = 0.93 at 2 mm. Beam efficiencies ηbeam were taken to be 0.81 at 85 GHz, 0.80 at 95 GHz, 0.79 at 105 GHz, and 0.74 at 145 GHz. The data were converted from the antenna temperature  to the main beam temperature scale Tmb using the values of the efficiencies given above.
Previous CH3OH observations were taken with the ABCD receivers at the IRAM 30 m telescope in January and May 2003 for the sources L1689B, L1709A, and L429. As backend, we used the autocorrelator VESPA with a frequency resolution of 40 kHz at 3 mm and 2 mm, and 80 kHz at 1 mm, corresponding to velocity resolutions of 0.12–0.08 km s-1 depending on frequency. These data were taken in the position-switching mode with an off position free of methanol emission. The targeted transitions are also listed in Table 2. The main beam efficiencies were 0.76, 0.69, 0.67, 0.57, and 0.46 at 96 GHz, 145 GHz, 157 GHz, 206 GHz, and 254 GHz, respectively, while forward efficiencies were 0.95 at 96 GHz, 0.93 at 145 and 157 GHz, 0.91 at 206 GHz, and 0.88 at 254 GHz. As with the newer observations described above, the spectra were converted to the main beam temperature scale Tmb using these values. During these observing runs, pointing was checked every 1.5–2 h and was found to be accurate to within 3–4′′. The beam sizes were 12′′ and 10′′ at 206 GHz and 254 GHz, respectively (and the same as given above at the lower frequencies). The H2CO observations used in this study for the sources L1689B, L429, and L1709A were taken from Bacmann et al. (2003), and those for L1517B are taken from Tafalla et al. (2006).
Molecular transitions observed, with their frequencies, upper-level energies Eup, upper-level degeneracy gup, Einstein spontaneous emission coefficient Aul.
The frequencies, upper-level energies and degeneracies, and Einstein coefficients of the observed molecular transitions are listed in Table 2). Both the methoxy radical and methanol have A- and E- type states, which were considered as separate species (though only E-CH3O was observed). Deep integrations were performed around 82−86 GHz, since CH3O lines are weak with rms noise down to 2−6 mK for most sources. For higher frequency observations targeting the much stronger methanol lines, rms noise is in the range of 30−60 mK.
Observations were reduced using the IRAM GILDAS/ CLASS software1, which consisted in coadding the spectra and folding them in order to deconvolve them from the frequency-switching procedure. A low order (typically 3) polynomial was then fitted over line-free regions to correct for baseline oscillations. The resulting spectra were then converted from the  to the Tmb scale using the values of the efficiencies given above. The lines were fitted with a Gaussian from which the peak temperatures, linewidths, and velocity-integrated line intensities were derived. The error on the integrated intensities was taken to be the quadratic sum of the statistic error and a calibration error, estimated to be 10% at 3 mm, 15% and 2 mm, and 20% at 1 mm. For non-detections, a 3 σ upper limit defined as 3
  is given, where Δv is the linewidth, ΔV the velocity resolution, and σrms the rms noise determined from the baseline fitting. The resulting line parameters are given in Tables B.1−B.3 for HCO, CH3O, and CH3OH, respectively. For some sources, methanol was observed at two different epochs, and where observations are duplicate, we chose to use the newer observations in order to have a main body of observations coming from the same receivers. The older observations are only used when no other observation is available. We did check, however, that new and old observations were consistent within the uncertainties. Spectra of HCO, CH3O, and CH3OH in L1689B are shown in Figs. 1−3, respectively.
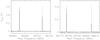 |
Fig. 1 HCO spectra in L1689B. The vertical dashed lines indicate the positions of the HCO transitions. |
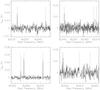 |
Fig. 2 CH3O spectra in L1689B. The vertical dashed lines indicate the positions of the CH3O transitions. |
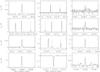 |
Fig. 3 CH3OH spectra in L1689B. The vertical dashed lines indicate the positions of the CH3OH transitions. Channels appearing as absorption features arising from the frequency-switching observing procedure were blanked for clarity. |
3. Results
3.1. HCO and CH3O
The formyl radical was detected in all sources, showing it is ubiquitous towards cold starless cores (Table B.1). The non-detection of HCO in L183 by Schenewerk et al. (1988) can be explained by the lack of sensitivity of their observations, since in our weakest sources, HCO lines are at 25−30 mK, consistent with their upper limits. The methoxy radical, on the other hand, is detected in only four out of eight sources (Table B.2), but its lines are much weaker (typically a factor of 10 less than HCO lines), and it is likely that it is present in all the sources of our sample.
There are no available collisional rates of HCO and CH3O with H2 or He, therefore we had to rely on an LTE-based approach to determine the column densities and abundances of these species, assuming a single excitation temperature Tex for all transitions. This approximation is likely to hold since i) the hyperfine transitions belong to the same rotational transition and ii) opacities are low (see Faure & Lique 2012). In this approximation, supposing Gaussian profiles, the integrated line intensity W is given by  where TCMB is the cosmic microwave background temperature, τ0 the line centre opacity, dυ the linewidth, and Jν refers to the radiation temperature at frequency ν defined by Jν(T) = hν/k(exp(hν/kT)−1)-1. The line centre opacity is
  with N the total molecular column density, c the light velocity, gup the upper level energy, Aul the Einstein spontaneous emission coefficient, ν the frequency of the transition, and Qpart the partition function derived at temperature Tex.
With the above formulae, grids of integrated intensities were calculated for a range of values in Tex and N. For each value of [Tex, N], a χ2 was derived to assess the distance between the modelled and the observed integrated line intensities. The χ2 isocontours were plotted as a function of Tex and N, 1σ contours corresponding to  , as appropriate for a two-parameter model Avni (1976). The χ2 was also minimised for fixed values of the excitation temperature (4, 6, and 8 K), as explained below.
3.1.1. HCO
Our data do not enable us to determine the excitation temperature, because any excitation temperature above 3.5 K would yield a fit within the 1σ contours; however, the plots show that for values of Tex higher than typically 4 K, the column density does not change significantly. For Tex lower than ~4 K, the column densities cannot be determined with accuracy, because they increase quickly with small decreases in Tex, and the opacities of the lines increase. Gerin et al. (2009) determine an excitation temperature of 5 K towards the PDR of the Horsehead and assume the same Tex for their dense core position. Generally the derived χ2 values at fixed temperatures tend to favour excitation temperatures of 4 K over 6 or 8 K (except for L1521E and L1517B), but most of the time the difference is small. The χ2 minimised over the whole parameter space was obtained for Tex values close to 4 K (except for L1517B and L1521E for which it was 7−8 K) and even as low as 3 K for L429, TMC 2 and L1512, but as before, models with other values of Tex were not significantly worse. Because of the impossibility of determining the excitation temperature, we chose here to determine the column densities at Tex = 4 K for all sources (Table 3). If the actual Tex is above 4 K, this will not change the column density values very much. We cannot, however, completely exclude Tex values between 3 and 4 K because such values have already been observed in other species (Padovani et al. 2011; Hily-Blant et al. 2013). Should the excitation temperatures actually be below 4 K, the column densities would be higher than those quoted in Table 3. Rates for collisional excitation, as well as higher upper energy level transitions, would help lift the degeneracy between Tex and the column density. The column densities derived span a range of 7.1 × 10¹¹× cm-2 to 1.3 × 1013 cm-2, i.e. a factor of nearly 20. This encompasses the value derived by Gerin et al. (2009) towards their dense core source and that of Cernicharo et al. (2012) towards B1-b.
3.1.2. CH3O
For CH3O, the situation is similar to HCO: determining the excitation temperature is not possible for most sources. Above 4 K, the column density does not depend on Tex, but below 4 K, small variations in Tex lead to large uncertainties on the column densities. For L1495A-S and TMC 2, only two lines of E-CH3O were detected, and it is possible to find a model that reproduces the integrated line intensities for any assumed excitation temperature between 3 K and 9 K. In L1689B, on the other hand, we detected eight E-CH3O lines that belong to two groups of hyperfine transitions with different upper level energies (Table 2), which enables us to constrain the excitation better. The best-fitting model is obtained for Tex = 8 K, with the best model for Tex = 6 K being clearly worse (despite the best fitting column density being similar). For this reason, we chose to determine the column densities for Tex = 8 K in all sources. This value of the excitation temperature is close to the value of Tex = 10 ± 3 K derived by Cernicharo et al. (2012) from their data. The CH3O column densities are given in Table 4. Since only E-type CH3O was observed, we assumed an A/E CH3O ratio of 1.25 to derive the total (A+E) CH3O column density. This corresponds to the ratio of the partition functions of both subspecies at a temperature of 10 K (close to the cores kinetic temperatures), which is expected to be the abundance ratio of the molecules if they equilibrated on grain surfaces and preserved their A/E ratio after evaporating. In the high temperature limit, the ratio of the partition functions is equal to 1. Upper limits at 3σ in the sources where CH3O was not detected were also calculated for Tex = 8 K. As for HCO, the column density values will be higher if the line excitation temperature is lower than 4 K.
The column density values range from ~5 × 1011 cm-2 to 1.2 × 1012 cm-2, although the 3σ upper limits for L1517B, L1512, and L1521E indicate column densities lower than 2 × 1011 cm-2. This is also consistent with the CH3O column density derived by Cernicharo et al. (2012) towards B1-b.
3.2. CH3OH
Methanol was detected in all sources. Like for the previously discussed species, HCO and CH3O, the lines in L1689B are by far the strongest of the sources in the sample. Line strengths (and detection rates) varied widely across the source sample with L1512 and L1517B showing only a few weak lines, despite the rms sensitivity being similar as in most other sources. The ρ Oph sources and L429 (in Aquila) have larger linewidths (Δv ~ 0.45 km s-1) than the Taurus sources, for which Δv ~ 0.35 km s-1. This is generally attributed to a more turbulent environment in ρ Oph. Between 6 and 19 transitions were detected both in A- and in E- CH3OH depending on the source (Table B.3).
Line parameters (linewidth, integrated line intensity, peak line intensity) are given in Table B.3. Interestingly, the A-CH3OH line at 107.013 GHz is seen in absorption against the cosmic microwave background. This is similar to the absorption seen at cm wavelengths in H2CO (Palmer et al. 1969; Townes & Cheung 1969) or in SO2 (Cernicharo 2012). In CH3OH, the absorption occurs at relatively high densities (a few 105 cm-3) and brings strong constraints on the physical conditions prevailing in prestellar cores. We postpone the discussion of this aspect to a future paper.
The column densities for CH3OH were determined using the RADEX radiative transfer code (van der Tak et al. 2007) using the large velocity gradient (LVG) approximation. The rate coefficients for collisional excitation of CH3OH with H2 used in our LVG calculation were computed by Rabli & Flower (2010). Only collisions with para-H2 were considered in our calculation because ortho-H2 represents at most 0.1−1% of the total H2 in prestellar cores, where the gas temperature is around 10 K (Faure et al. 2013; Pagani et al. 2009; Dislaire et al. 2012). We did, however, check that adding 1% of ortho-H2 does not change the outcome of our calculation. No a priori A-CH3OH/E-CH3OH was assumed, and A- and E-type CH3OH were treated as two distinct species. As methanol is likely formed for the most part on grain surfaces (Geppert et al. 2006), the A-CH3OH/E-CH3OH ratio is expected to be equal to the ratio of the partition functions, i.e. 1.4 at 10 K, and decreasing towards 1 with increasing temperature.
For each source, we calculated line intensities for ranges of values in column density, temperature, and H2 density. The LVG code requires the linewidth as an input parameter, which was taken for each source as an average value of the detected lines (typically around 0.35 km s-1 for the Taurus sources and 0.45 km s-1 for the ρ Oph sources, see above). The linewidth, however, only has very little effect on the output integrated line intensities. The column densities were varied typically from 1013 cm-2 to 2.5 × 1014 cm-2 in steps of 1013 cm-2 (or from 1012 cm-2 to 2 × 1013 cm-2 in steps of 1012 cm-2 for L1512 and L1517B which have lower CH3OH column densities), the temperatures from 6 K to 14 K in steps of 0.5 K and the densities from 104 cm-3 to 106 cm-3 in steps of 104 cm-3. Finer grids in column density were used around the value best reproducing the observations, or the grids were extended when the solution was close to or at the boundary of the parameter space. The A- and E-type methanols were assumed to be coexistent; i.e., the models for A-CH3OH and E-CH3OH were calculated assuming the same density and temperature (but different column densities in A-CH3OH and E-CH3OH). Under this hypothesis, the χ2 values of the model are calculated by summing over all detected methanol lines, i.e.  where the index i refers to the E-CH3OH lines and the index j to the A-CH3OH lines, Wobs and σobs are, respectively, the observed integrated intensity of the considered line and the 1σ error on this value (Table B.3), and Wcalc is the integrated intensity calculated by the LVG model.
The E-CH3OH transition at 108.895 GHz was consistently poorly fitted by the models. In fact, the collisional rate for this line turns out to be set to zero, as is the case for a few transitions in the coupled states approximation used by Rabli & Flower (2010) in their calculations. We therefore chose to exclude the line of E-CH3OH at 108.894 GHz in deriving the χ2 of the model because its excitation might not be calculated well by the LVG code.
Some transitions (e.g. the lines at 157.271 GHz and 254.015 GHz) are also not very well reproduced by the model in most of the sources. The simplicity of our model (single-density and single-temperature) probably accounts for the discrepancy between the observed and calculated integrated intensities for these lines. However, that our model systematically under-reproduces the intensities of these lines, which are mostly excited at high densities, is an indication that there is some methanol emission arising from higher density regions than that of our simple model.
The parameters minimising the χ2 and the derived CH3OH column densities are listed in Table 5. This should yield the model that reproduces the observations best. The 1σ confidence intervals on these parameters were determined from the range of model parameters verifying  (Avni 1976), as suited for a three-parameter model. The 1σ uncertainties are given in Table 6.
The total CH3OH column densities span about a factor of 10 from 1013 cm-2 in the weakest Taurus sources to 1.3 × 1014 cm-2 in L1689B. Other measurements of methanol abundances in dark cores (Friberg et al. 1988; Guzmán et al. 2013; Bizzocchi et al. 2014) yielded column densities close to 2 × 1013 cm-2, which is within the range we derived, although most of our values are higher. One source of the sample, L1517B, was already observed in CH3OH by Tafalla et al. (2006), whose model is consistent with a column density of 4 × 1012 cm-2, when our value is nearly three times more. The presence of such a large discrepancy between our column density and that of Tafalla et al. (2006) is not completely clear. Our spectra of the lines at 96.739, 96.741, 145.097, and 145.103 GHz, which were taken at the continuum peak of the source, present different intensities to those of Tafalla et al. (2006), which were averaged from several spectra in a 20′′ radius around that peak. Whereas we estimate the column density at one position, Tafalla et al. (2006) assume an H2 density profile to fit an abundance to their methanol maps data, and it is unclear how this assumption will affect their total column density. Nevertheless, an important aspect in our study is that we proceed similarly and consistently for all of our sources and that all the species were observed at the same position for each source, to allow us to compare the various relative abundances. We therefore keep our value for the methanol column density in L1517B.
The A/E ratios are between 1 and 1.5, with most of them around 1.2, except for L1495A-S, where it is lower than 1 (0.7). It should be noted that this is consistent with grain surface formation and nuclear-spin equilibration at temperatures around 10 K. For L1495A-S, a ratio of 1 is still within the uncertainties. The densities optimizing the fit are above 105 cm-3 (see Table 5), which is similar to values usually derived at the centres of prestellar cores, and this would tend to indicate that some methanol emission arises from the central parts of the cores. This is a little surprising, because methanol, like most other C-bearing species, is expected to be depleted at the core centres, so that the emission should come from less dense regions (Vastel et al. 2014). Most of our density values have large uncertainties, but except for TMC 2 and L1517B, those uncertainties point towards higher values of the densities. Density estimates from the literature come from modelling of dust continuum emission and relies on assumptions on the dust emission coefficients that are still poorly constrained, so that these values are also uncertain by a factor of at least 2–3. Given these facts, the densities found here are generally in agreement with the central densities quoted in the literature for those cores, i.e. 2 × 10⁵ in L1517B (Tafalla et al. 2006), 2.7 × 105 cm-3 in L1521E (Tafalla & Santiago 2004), 3 × 10⁵ in TMC 2, 1.5 × 10⁵ in L1689B, and 6 × 10⁵ in L429 (Crapsi et al. 2005). The gas kinetic temperature values from our model are below 10 K (Table 5), which is consistent with the emission coming from the denser parts of the cores. Some values are very low (6 K), but because of the high uncertainties, this result might not be meaningful. Padovani et al. (2011), however, do not exclude such very low temperatures in TMC 2 and L1521E. Extreme caution should be taken interpreting densities from LVG modelling because they will be dependent on the transitions used and their critical densities. Indeed, the various transitions probed can arise from regions of different densities (and temperatures), which is not taken into account by uniform LVG models, so that the densities yielding the best fit in an LVG model should rather represent an average density in the source. A non-local radiative transfer calculation should be performed to determine the spatial origin of the emission, which, however, requires having a map of the source in several transitions and a source model. Such an analysis is beyond the scope of the current paper.
Our modelling also enables us to determine the opacities of the CH3OH lines. The transitions at 96.739, 96.741, 145.103, 157.271, and 157.276 GHz are often (moderately) optically thick, with opacities between one and two for the most optically thick ones, so that care should be taken when deriving column densities using only (some of) these lines.
HCO column densities for Tex = 4 K with 1σ error bars.
CH3O (A+E) column densities for Tex = 8 K.
Best-fit CH3OH (A and E) column densities.
1σ uncertainties for CH3OH (A and E) column densities.
4. Discussion
In each source, the linewidths of the different species are very similar so that they are most probably coexistent. The abundances of H2CO, CH3O and CH3OH with respect to HCO are reported in Table 7. In the table we chose HCO as the reference because it was observed and detected in all sources. The H2CO data come from the literature, but only half of the sources in our sample have been observed in this species. The H2CO column densities for L1689B, L429, and L1709A are 1.3 × 1014 cm-2, 2.8 × 1013 cm-2, and 5.6 × 1013 cm-2, respectively (Bacmann et al. 2003). For L1517B, the column density was integrated from the H2CO radial abundance profile described in Tafalla et al. (2006), and found to be 5.2 × 1012 cm-2.
While the column densities in the species vary by over an order of magnitude between the different sources, their ratios show relatively little variations. Indeed, we find that within a factor of 2, the HCO:H2CO:CH3O:CH3OH ratios are close to 10:100:1:100. For H2CO, the comparison between L1689B, L429, and L1709A, on the one hand, and L1517B, on the other, should be made cautiously since the column densities have been determined with different methods. Besides this, the lines observed in L1517B have very high optical depths and are self-absorbed, and no optically thin isotope was observed. This H2CO column density value could therefore be underestimated. The result that HCO is about ten times more abundant than CH3O seems robust2, and the upper limits derived in the sources where CH3O was not detected are also consistent with this number, although they may not be stringent enough. TMC 2 has a higher CH3O relative abundance than the other sources, but its detection is marginal since the strongest lines are only at the 3σ level. Similarly, CH3OH is 10 to 25 times more abundant than HCO and the H2CO abundances are of the same order of magnitude as in CH3OH. The latter is consistent with previous results obtained by Guzmán et al. (2013), who found a H2CO/CH3OH ratio of 0.9 at the dense core position in the Horsehead nebula.
Available chemical models have difficulty accounting for our observational results. The model recently proposed by Vasyunin & Herbst (2013) shows the abundances of complex organic molecules, as well as CH3O, CH3OH, and H2CO. The abundances of H2CO and CH3OH are similar only towards steady state, at which times the CH3OH/CH3O abundance ratio is ~30, slightly lower (a factor of ~3) than our observations. In the model, CH3O is over an order of magnitude more abundant than molecules like CH3CHO or CH3OCHO, whereas in L1689B CH3O is observed to be an order of magnitude less abundant than these species (Bacmann et al. 2012). In the model of Balucani et al. (2015), the CH3OH/CH3O abundance ratio is close to our observed values for ages of at most a few 105 yr. This is unlikely to be the age of all cores in our sample, as the lifetime of cores is estimated to be around 106 yr (André et al. 2014). At average core ages, the model predicts no detectable amount of methanol in the gas phase.
In the following sections, we explore various chemical routes to explain the observed HCO:H2CO:CH3O:CH3OH abundance ratios, focussing on the dominant formation and destruction reactions. Square brackets refer to molecular abundances with respect to H2.
Abundance ratios with respect to HCO.
4.1. Grain surface formation route
According to current understanding (Geppert et al. 2006; Garrod et al. 2006), methanol forms on grain surfaces from the successive additions of H atoms to CO, following CO → HCO → H2CO → CH3O → CH3OH. This sequence of reactions has been studied in the laboratory at 10 K by Watanabe & Kouchi (2002) and both at 10 K and at 3 K by Pirim et al. (2010) and Pirim & Krim (2011a). The intermediate radicals HCO and CH3O are not observed in the experiments by Watanabe & Kouchi (2002), but they are detected at 10 K in those by Pirim et al., who co-deposited CO and H in their study, whereas Watanabe & Kouchi (2002) injected H only after CO had been already deposited. Pirim & Krim (2011a) have also shown that in the presence of water, the HCO conversion into H2CO and that of H2CO into CH3O and CH3OH are enhanced. Water thus acts as a catalyst of CO hydrogenation. As a result, in interstellar grain mantles dominated by water, only the most stable intermediates H2CO and CH3OH are expected to be present with significant abundances.
In prestellar cores, at 10 K, the successful grain-surface hydrogenation of CO into H2CO and CH3OH will depend on the competition between H addition on the grains and CO desorption: if CO can desorb before H accretes on the grain and reacts with CO, no CO hydrogenation will take place. The same applies to the other H2CO and CH3OH precursors, such as HCO and CH3O. The timescale for hydrogenation on a grain surface in the dense interstellar medium is very short, since H atoms physisorbed on the grains can scan the whole surface many times before evaporating back into the gas phase (Tielens & Hagen 1982), and it is therefore not a limiting factor for the hydrogenation of the species on the grains. And typically, one H atom will arrive on a grain every day. Timescales for desorption for the methanol precursors either by cosmic ray impacts or by secondary UV photons are of the order of 104−105 yr (Tielens 2010; Banerji et al. 2009). This means that the radicals HCO and CH3O will have ample time to be hydrogenated before they can be desorbed.
The hydrogenation of the unstable radicals HCO and CH3O into H2CO and CH3OH, respectively, is believed to take place quickly, whereas the formation of these radicals from CO and H2CO has a barrier (about 2500 K and 2200 K, respectively −Garrod et al. 2008; Osamura et al. 2005), according to both theoretical calculations and experiments (Peters et al. 2013; Wang et al. 1973)3. It is therefore likely that H atoms arriving on the grain surface will usually react with HCO or CH3O rather than with CO or H2CO, leading to the most stable products.
Taking all these arguments into account, it is therefore possible that the amounts of HCO and CH3O on interstellar grain surfaces are very small and that the HCO and CH3O seen in the gas phase is the product of gas-phase processes. We present below possible gas-phase formation routes for HCO and CH3O and discuss their validity with respect to our observational results. In the simple chemical modelling presented below, we re-evaluated the reaction rates for charge-dipole reactions using the “locked dipole” approximation. The method is described in Appendix A. The adopted reaction rates are listed in Table 8.
4.2. Neutral-neutral pathways
Recent experimental results by Shannon et al. (2013) show that neutral-neutral reactions such as CH3OH + OH → CH3O + H2O accelerate at low temperatures (T = 63 K in their experiment) despite having a barrier. Those results were confirmed and extended to lower temperatures by Gómez Martín et al. (2014). Similarly, other neutral-neutral reactions, such as the barrierless reaction CH3OH + CN (Sayah et al. 1988), also produce CH3O. HCO can be formed with the corresponding reactions involving H2CO instead of CH3OH and also with CH3OH + C (Shannon et al. 2014). The following reaction may therefore be considered for the formation of CH3O: 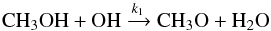 (1)and for its destruction
 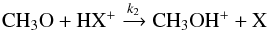 (2)where HX+ stands in fact for any major positive ion which can easily give a proton (e.g. H
 ). This reaction has so far not been considered in any of the public astrochemical networks (KIDA, UMIST −McElroy et al. 2013). At steady state, the abundance of CH3O is given by
 ![Mathematical equation: \begin{equation} \mathrm{[CH_3O]=\frac{{\it k}_1[CH_3OH][OH]}{{\it k}_2 [HX^+]}} \end{equation}](/articles/aa/full_html/2016/03/aa26198-15/aa26198-15-eq126.png) (3)where the square brackets indicate abundances (with respect to H2). Assuming a typical abundance of 10-8 for positive ions, consistent with the ionisation fraction in dark cores (Flower et al. 2005, 2006; Pagani et al. 2009), an average abundance of 8 × 10⁻⁸ for OH (Troland & Crutcher 2008; Crutcher 1979), we find that [CH3O] = 8 k1/k2[CH3OH]. With the values of the reaction rates from Table 8, this leads to an abundance of [CH3O] ~ 0.007 [CH3OH], which is slightly lower than but close to what is measured observationally ([CH3O] = 1/100 [CH3OH]). In this simple scheme, we also assumed that CH3O is the sole product of reaction (1), as explained in Shannon et al. (2013). The OH abundance given here is, however, uncertain as it is the typical abundance measured from low critical density lines over a large beam (3 arcmin for the Arecibo telescope at 1.6 GHz) and may not be representative of what is seen on smaller scales towards the centres of prestellar cores. Other destruction routes, such as the depletion of CH3O on grains, are not efficient compared with ion-molecule reactions like those mentioned above. Indeed, depletion rates onto grains are about kdepl = 3 × 10⁻⁶ cm3 s-1 for species with a similar mass to CO (Hasegawa & Herbst 1993), and grain abundances [g] of the order of 2 × 10-12 (Li & Goldsmith 2003). The disappearance of CH3O due to depletion is therefore less efficient than its destruction by proton donors by a factor:
(3)where the square brackets indicate abundances (with respect to H2). Assuming a typical abundance of 10-8 for positive ions, consistent with the ionisation fraction in dark cores (Flower et al. 2005, 2006; Pagani et al. 2009), an average abundance of 8 × 10⁻⁸ for OH (Troland & Crutcher 2008; Crutcher 1979), we find that [CH3O] = 8 k1/k2[CH3OH]. With the values of the reaction rates from Table 8, this leads to an abundance of [CH3O] ~ 0.007 [CH3OH], which is slightly lower than but close to what is measured observationally ([CH3O] = 1/100 [CH3OH]). In this simple scheme, we also assumed that CH3O is the sole product of reaction (1), as explained in Shannon et al. (2013). The OH abundance given here is, however, uncertain as it is the typical abundance measured from low critical density lines over a large beam (3 arcmin for the Arecibo telescope at 1.6 GHz) and may not be representative of what is seen on smaller scales towards the centres of prestellar cores. Other destruction routes, such as the depletion of CH3O on grains, are not efficient compared with ion-molecule reactions like those mentioned above. Indeed, depletion rates onto grains are about kdepl = 3 × 10⁻⁶ cm3 s-1 for species with a similar mass to CO (Hasegawa & Herbst 1993), and grain abundances [g] of the order of 2 × 10-12 (Li & Goldsmith 2003). The disappearance of CH3O due to depletion is therefore less efficient than its destruction by proton donors by a factor: ![Mathematical equation: \begin{eqnarray*} \frac{{k}_2\, [\mathrm{HX}^+]}{\mathrm{{\it k}_ {\rm depl}} \,[{\rm g}]} \approx 100. \end{eqnarray*}](/articles/aa/full_html/2016/03/aa26198-15/aa26198-15-eq136.png) For HCO formation, the corresponding neutral-neutral route is
For HCO formation, the corresponding neutral-neutral route is 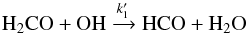 (4)and for its destruction
 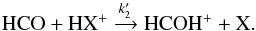 (5)The abundance of HCO is therefore [HCO] = 8
  /
/ [H2CO]. No measurement of the rate coefficient for reaction (4) exists at low temperatures, however measurements at 230 K give
  cm3 s-1 (Baulch et al. 2005). Using this value, we derive [HCO] = 1.6 × 10⁻³ [H2CO]. This is about two orders of magnitude less than the value we measure. Again, we have assumed that HCO is the sole product of reaction (4), as suggested in Baulch et al. (2005).
In our simple model, the abundance ratio [HCO]/[CH3O] is equal to (/k1)(k2/)[H2CO]/[CH3OH]. This is independent of any assumption on the OH or proton donor abundance. Compared with our observed ratio, this means that would have to be 4 × 10⁻¹⁰ cm3 s-1 at 10 K in order to explain our results. This value is close to the upper limit for neutral-neutral reactions, but it cannot be ruled out, since similarly high reaction rate values between neutrals have been reported at low temperatures in, for example, Sims et al. (1994).
4.3. Ion-molecule fomation route
Ion-molecule reactions represent an alternative, faster pathway to form CH3O and HCO. For such a scheme, a possible formation route to CH3O would be  (6)followed by the dissociative recombination,
 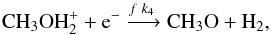 (7)where, again, HX+ stands for a positive ionic proton donor, like H. In the present reaction rate databases, reaction (7) was omitted as a production route for CH3O. The destruction route for CH3O is the same as in the previous section.
We denote k3 and k4 as the destruction rate of the reactants in reactions (6) and (7), and r and f the branching ratios for the products CH3OH and CH3O, respectively.
At steady state, the CH3O abundance can be written as ![Mathematical equation: \begin{equation} \mathrm{[CH_3O]=\frac{\mathit{f}\;{\it k}_4 [CH_3OH_2^+][e^-]}{{\it k}_2 [HX^+]}}\label{ch3oabund}\cdot \end{equation}](/articles/aa/full_html/2016/03/aa26198-15/aa26198-15-eq152.png) (8)The CH3OH abundance is
(8)The CH3OH abundance is ![Mathematical equation: \begin{equation} \mathrm{[CH_3OH_2^+]=\frac{\mathit{r}\;{\it k}_3 [CH_3OH][XH^+]}{{\it k}_4 [e^-]}}\cdot \label{ch3oh2abund} \end{equation}](/articles/aa/full_html/2016/03/aa26198-15/aa26198-15-eq153.png) (9)Substituting (9) in (8), we find that, at steady-state,
(9)Substituting (9) in (8), we find that, at steady-state, ![Mathematical equation: \begin{equation} \mathrm{[CH_3O]=\frac{\mathit{f\;r}\;{\it k}_3}{{\it k}_2}[CH_3OH]} . \end{equation}](/articles/aa/full_html/2016/03/aa26198-15/aa26198-15-eq154.png) (10)According to Geppert et al. (2006), the branching ratio f for CH3O production from CH3OH dissociative recombination is about 6%. The value for r derived from the KIDA4 database (Wakelam et al. 2012) is 25% (assuming HX+ to be mostly H). This yields
(10)According to Geppert et al. (2006), the branching ratio f for CH3O production from CH3OH dissociative recombination is about 6%. The value for r derived from the KIDA4 database (Wakelam et al. 2012) is 25% (assuming HX+ to be mostly H). This yields ![Mathematical equation: \begin{eqnarray*} \mathrm{[CH_3O] = 1.2\times10^{-2}~ [CH_3OH].} \end{eqnarray*}](/articles/aa/full_html/2016/03/aa26198-15/aa26198-15-eq155.png) This can account for the CH3O observed in our sources. Following Eq. (9), the abundance of CH3OH is
This can account for the CH3O observed in our sources. Following Eq. (9), the abundance of CH3OH is ![Mathematical equation: \begin{eqnarray*} \mathrm{[CH_3OH_2^+] = 1.5\times10^{-3}~ [CH_3OH] } \end{eqnarray*}](/articles/aa/full_html/2016/03/aa26198-15/aa26198-15-eq156.png) where we have made the approximation that [HX+] ≈ [e−].
where we have made the approximation that [HX+] ≈ [e−].
Similar reactions can be considered for the formation of HCO:
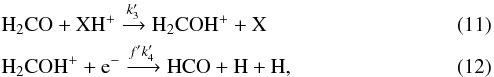 and again, reaction (5) accounts for the destruction of HCO. As before,
  is the rate at which H2COH+ is destroyed by electrons and f′ the branching ratio towards the HCO product. Unlike methanol, the reaction of H2CO with a proton donor such as H
 gives H2COH+ as the only product, according to the KIDA database. The abundance of HCO can be written as
 ![Mathematical equation: \begin{equation} \mathrm{[HCO]=\frac{\mathit{f^\prime}\;{\it k}^\prime_4 [H_2COH^+][e^-]}{{\it k}^\prime_2[HX^+]}}\label{hcoabund}\cdot \end{equation}](/articles/aa/full_html/2016/03/aa26198-15/aa26198-15-eq162.png) (13)In turn, the H2COH+ abundance is
(13)In turn, the H2COH+ abundance is ![Mathematical equation: \begin{equation} \mathrm{[H_2COH^+] = \frac{{\it k}^\prime_3 [H_2CO][XH^+]}{{\it k}^\prime_4 [e^-]}}\label{h2cohabund} , \end{equation}](/articles/aa/full_html/2016/03/aa26198-15/aa26198-15-eq163.png) (14)and finally, substituting Eq. (14) into Eq. (13) the HCO abundance is
(14)and finally, substituting Eq. (14) into Eq. (13) the HCO abundance is ![Mathematical equation: \begin{equation} \mathrm{[HCO]=\frac{\mathit{f^\prime}\;{\it k}^\prime_3}{{\it k}^\prime_2} [H_2CO]}. \end{equation}](/articles/aa/full_html/2016/03/aa26198-15/aa26198-15-eq164.png) (15)Hamberg et al. (2007) carried out experimental measurements of the dissociative recombination of protonated formaldehyde H2COH+. They found that fragment products where the C−O bond is preserved make up 92% of the total yield of the reaction. However, they were not able to distinguish between the various products containing a C−O bond (HCO, CO, or H2CO), so that the branching ratio they give is only an upper limit for f′. We assume f′ = 10% for the formation of HCO from the dissociative recombination of H2COH+.
(15)Hamberg et al. (2007) carried out experimental measurements of the dissociative recombination of protonated formaldehyde H2COH+. They found that fragment products where the C−O bond is preserved make up 92% of the total yield of the reaction. However, they were not able to distinguish between the various products containing a C−O bond (HCO, CO, or H2CO), so that the branching ratio they give is only an upper limit for f′. We assume f′ = 10% for the formation of HCO from the dissociative recombination of H2COH+.
List of reactions and adopted rates at 10 K and adopted branching ratios for reactions with several output channels.
With this hypothesis and the rate coefficient values from Table 8, the HCO abundance is ![Mathematical equation: \begin{equation} \mathrm{[HCO]=0.14\;[H_2CO]} , \end{equation}](/articles/aa/full_html/2016/03/aa26198-15/aa26198-15-eq182.png) (16)which is close to what is observed in our sources. A gas-phase route with ion-molecule reactions could therefore produce both enough HCO and CH3O to account for the observed abundances. In what precedes, we have neglected that protonated formaldehyde can additionally be formed from the reaction of methanol with H; however, given the rate for that reaction (~6 × 10⁻⁹ cm3 s-1), this would increase the abundance by only 50%. The abundance of protonated formaldehyde is then
(16)which is close to what is observed in our sources. A gas-phase route with ion-molecule reactions could therefore produce both enough HCO and CH3O to account for the observed abundances. In what precedes, we have neglected that protonated formaldehyde can additionally be formed from the reaction of methanol with H; however, given the rate for that reaction (~6 × 10⁻⁹ cm3 s-1), this would increase the abundance by only 50%. The abundance of protonated formaldehyde is then ![Mathematical equation: \begin{equation} \mathrm{[H_2COH^+]=7\times10^{-3}[H_2CO]} \end{equation}](/articles/aa/full_html/2016/03/aa26198-15/aa26198-15-eq184.png) (17)where we have taken
(17)where we have taken  cm3 s-1, the value derived at 10 K from Hamberg et al. (2007).
The extreme simplicity of our chemical model, as well as the uncertainties on the reaction rates (most of which have been calculated at 10 K and not measured) or branching ratios implies that the abundances we derive should be taken as rough estimates and not as precise values. Moreover, the steady-state hypothesis we have made might not be verified in prestellar cores, where dynamical and chemical timescales are of the same order of magnitude.
Time-dependent models with an elaborated network will be investigated in a future, dedicated study. Still, an interesting test of this ion-molecule scheme would come from the detection and abundance measurements of CH3OH and H2COH+. The abundances of these species derived from our model are 1.5 × 10⁻³ [CH3OH] and 7 × 10⁻³ [H2CO], respectively, which would be 1.5 × 10⁻¹² and 7 × 10-12 for a source like L1689B. CH3OH has never been detected, since its rotational frequencies have not been determined, but the abundance of H2COH+ was determined by Ohishi et al. (1996) in various types of sources and found to be around 10-11 in some of them. Though H2COH+ was looked for in dark clouds, it was not detected by these authors.
Although neutral-neutral reactions are generally slower than proton transfer in the gas phase, they can be competitive if the reactant is very abundant. Therefore, a possible alternative destruction route for HCO and CH3O is the reaction of these radicals with H atoms, following
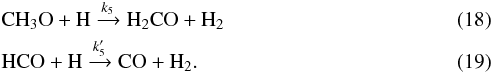 The only measurements of the rate constants for these reactions are at 300 K and above (Baulch et al. 2005), and it is extremely uncertain to extrapolate them at 10 K, since they could differ by an order of magnitude or more. Bearing this in mind, we try to estimate in the following the effect of these reactions. The corresponding abundances of CH3O and HCO are given by
![Mathematical equation: \begin{eqnarray} &&\mathrm{[CH_3O]=\frac{\mathit{f\;r}\; {\it k}_3 [CH_3OH][HX^+]}{{\it k}_5 [H]}}\\ &&\mathrm{[HCO]=\frac{\mathit{f^\prime} {\it k}^\prime_3 [H_2CO][HX^+]}{{\it k}^\prime_5 [H]}}\cdot \end{eqnarray}](/articles/aa/full_html/2016/03/aa26198-15/aa26198-15-eq191.png)
The atomic H density is typically around nH = 2−6 cm-3 independent of the density (Goldsmith & Li 2005), and the atomic H abundance ([H] = nH/nH2) is therefore between a few 10-6 and a few 10-5. If the values of the rate constants at 300 K hold at 10 K (see Table 8), this would lead to [ CH3O ] = 2.3 × 10⁻⁷ [ CH3OH ] / [ H ] and [ HCO ] = 4.7 × 10⁻⁷ [ H2CO ] / [ H ], which is a ratio [HCO]/[CH3O] = 2 [H2CO]/[CH3OH] ~ 2. This is not consistent with our observations. We note, however, that increasing  by a factor of 5 would produce the observed ratio.
Similar destruction reactions with other radicals like atomic oxygen are also possible with similar reaction rates. The abundance of O in prestellar cores is extremely uncertain, but it is expected drop below 10-6 after 2 × 10⁵ yr (Aikawa et al. 2003) so that the main neutral-neutral destruction route of HCO and CH3O should be with H instead. If O were as abundant as H, the destruction rate of CH3O and HCO by neutrals (assuming these rates are similar in the case of O and in the case of H) would be a factor of two higher with respect to a destruction by H alone, but this would not affect our conclusions.
Line parameters for HCO observations in the protostellar source IRAS 16 293-2422.
4.4. Isomerisation of CH3O
The methoxy radical CH3O has a structural isomer, the hydroxy methyl radical CH2OH, which is more stable by about 42 kJ/mol (Wang & Bowie 2012). No microwave spectroscopic data are available in the literature, and as a consequence, the rotational transitions of CH2OH have never been detected in the interstellar medium. Shannon et al. (2013) conclude from their experimental study that CH3O is the dominant product of reaction (1) at low temperatures. The dissociative recombination of CH3OH, on the other hand, leads a priori to both isomers, and the proportion of CH3O with respect to CH2OH has not been determined experimentally. If this reaction should lead to CH2OH in non-negligible amounts, the value we took for the branching ratio f would be overestimated.
Theoretical calculations (Wang & Bowie 2012) predict that CH3O should isomerise into CH2OH. If this happens on timescales shorter than chemical timescales in prestellar cores, the isomerisation would become a major loss channel for CH3O. Unfortunately, experimental measurements have yielded only non stringent lower limits constraints on the isomerisation timescales (e.g. Gutman et al. 1982) of the order of 1s at room temperature, and indeed no evidence of isomerisation has been reported from experimental source.
4.5. Protostars
The ion-molecule gas-phase reactions we have considered were applied to cold medium conditions: values of the rate coefficients were taken at 10 K, ionisation fraction and dominant ions are those found in prestellar cores. Available observations of the young Class 0 protostar IRAS 16293-2422 from the TIMASSS survey (Caux et al. 2011) show the presence of HCO most probably originating in much warmer gas than 10 K (as shown by the HCO linewidths of 2−3 km s-1, compared to those of NH seen in the cold envelope −Bacmann et al. 2010) but CH3O remains undetected. The integrated line intensities for HCO in this source are given in Table 9. A similar LTE analysis to what is described for the prestellar cores gives an HCO column density of N(HCO) = 1.4 × 1013 cm-2 for Tex = 40 K and N(HCO) = 3.6 × 1013 cm-2 for Tex = 80 K. According to Loinard et al. (2000), the column density of H2CO in that source is N(H2CO) = 3.4 × 1014 cm-2. These measured abundances therefore also verify the [H2CO]/[HCO] ratio derived from our ion-neutral model described above. The methanol column density in this source is N(CH3OH) = 1016 cm-2 (Parise et al. 2004). Assuming [ CH3O ] = 0.01 [ CH3OH ] gives a column density of N(CH3O) = 1014 cm-2, and with this assumption, CH3O lines are expected to be above 100 mK, much higher than the rms of the TIMASSS spectral survey (6 mK, 13 mK, and 9 mK at the transition frequencies of methoxy 82.4 GHz, 137.4 GHz, and 247.4 GHz, respectively), independently of the assumed excitation temperature (between 10 K and 80 K). Clearly, the methoxy abundance in this source has to be much lower. Because of the uncertainty on the excitation temperature, it is difficult to give accurate upper limits for the CH3O abundance. For Tex = 40 K, methoxy should be detected provided the E-CH3O column density is higher than typically 2 × 1012 cm-2, and for Tex = 80 K if N(E−CH3O) is greater than 5 × 1012 cm-2.
A possibility of reconciling our model with the non-detection of methoxy in IRAS 16 293-2422 is to suppose that H2CO and CH3OH and their daughter molecules HCO and CH3O are formed in the prestellar phase. In the hot corino, methanol desorbs from the grains (increasing its column density by one to two orders of magnitude), but the gas-phase chemistry is limited by the short lifetime of the hot core phase, so that the HCO and CH3O column densities are still similar to what is measured in the prestellar phase. Indeed, the timescale for the H chemistry is typically tchem = 1/r , where
  is the H density. A typical value for k3 is a few 10-9 cm3 s-1 at 100 K for
  . If we take
  cm-3, we find a timescale for ion-molecule chemistry with H of tchem ~ a few 103 yr. This is shorter than the estimated lifetime of class 0 protostars in the ρ Ophiuchi region of about 45 000 yr (Evans et al. 2009), but larger than the estimated age of the IRAS 16 293-2422 hot corino (a few hundred years according to Schöier et al. 2002). These numbers should, however, be taken with caution because age estimates for hot corinos depend on the model and have high uncertainties. Incidently, the HCO column density we measure in the prestellar core L1689B is similar to the one derived in IRAS 16 293-2422. A CH3O column density of ~1012 cm-2 as in L1689B would remain undetected with the actual sensitivity of the TIMASSS survey in IRAS 16 293-2422.
It is, however, difficult to be conclusive from the observations of only one source. Clearly more observations of HCO and CH3O in the hot cores of low-mass protostars are needed to constrain the chemistry of these species in the warm/hot gas.
5. Conclusions
We observed the species HCO, CH3O, and CH3OH in a sample of eight prestellar cores and considered H2CO data from the literature. These species are believed to form on the grain surfaces by successive hydrogenations of CO. In addition, HCO and CH3O may play an important role as COM precursors on grain surfaces. The formyl radical HCO is detected in all sources and the methoxy radical CH3O in four of them. Since CH3O transitions are very weak and hard to detect in prestellar cores, it is likely that CH3O is as ubiquitous as HCO in prestellar cores but that more sensitive observations would have been needed to detect it in all sources. The column densities of the observed species vary by an order of magnitude across the source sample but their abundance ratios with respect to a common reference like CH3OH are remarkably similar in all the sources. We find that the abundance ratios HCO:H2CO:CH3O:CH3OH are close to 10:100:1:100.
Though it is not possible to completely exclude the possibility that these ratios can be produced by successive hydrogenations on grain surfaces, the timescales involved for grain surface accretion and hydrogenation vs. those for desorption do not favour a surface chemistry origin for HCO and CH3O. Most probably, in a mixture of CO and water ice, as is probably the case in these objects, the main product of the CO hydrogenation reaction is H2CO and CH3OH and very little HCO or CH3O remain on the grains at any given time. We examined possible gas-phase formation routes for HCO and CH3O, thereby introducing two new reactions involving CH3O that were omitted in previous models. Neutral-neutral reactions between CH3OH and radicals like OH have been shown experimentally to form CH3O and to be efficient at low temperatures. The CH3O abundance obtained by this process indeed reproduces the observed [CH3O]/[CH3OH] ratio. On the other hand, the corresponding reaction between H2CO and a radical like OH needs to be even faster, with a rate exceeding ~4 × 10⁻¹⁰ cm3 s-1 at 10 K, in order to account for the observed [HCO]/[H2CO] abundance ratios.
Ion-molecule offer a more viable alternative: abundant and reactive ions like H can react with H2CO and CH3OH to form H2COH+ and CH3OH, respectively. Upon dissociative recombination with electrons, these species form HCO and CH3O together with other products. Estimated rate coefficients were used to determine the [CH3O]/[CH3OH] and [HCO]/[H2CO] abundance ratios, together with experimental measurements of the products’ branching ratios for the dissociative recombination. We found that the measured [CH3O]/[CH3OH] abundance ratio can be accounted for well at steady state by this chemical route, and [HCO]/[H2CO] is also accounted well for by our model, provided that the branching ratio for HCO in the dissociative recombination of H2COH+ is close to 10%. Our model also predicts abundances of H2COH+ and CH3OH, and measuring the abundances of these species provides an important test of this reaction pathway. In the case of CH3OH, there is a need to first determine the frequencies of the transitions in the millimetre domain.
If the reactions we have proposed apply, the non-detection of CH3O in the protostar IRAS 16 293-2422 implies that the source is too young for the ion-molecule to have significantly proceeded. In any case, more observations of CH3O in protostellar sources are needed.
Our model is based on several critical reactions, which involve key intermediate species, for which there is an urgent need of experimental measurements, the rates of which have not been measured experimentally at low temperatures (~10 K), or for which branching ratios are insufficiently constrained. These reactions are listed in Table 8.
Finally, there is a strong need to constrain the gas-phase abundance of the isomer CH2OH and to this effect, to determine its microwave spectrum, which is currently lacking. Our gas-phase scheme is consistent with CH2OH being less abundant than CH3O. Should it be much more abundant, other processes would have to be at work than the gas-phase scheme we propose.
Cernicharo et al. (2012) find [HCO]/[CH3O] ≈ 4 in B1-b, but they have assumed an excitation temperature of 10 K for HCO, which leads to lower column densities than the excitation temperature of 4 K that we have derived.
Recent experiments by Pirim & Krim (2011b) show, however, that H+CO proceeds with no or a very small barrier at 3 K, so that the issue is not completely settled.
Acknowledgments
This work has benefitted from the support of the CNRS programme “Physique et Chimie du Milieu Interstellaire” (PCMI). J.-C. Loison and K. Hickson are acknowledged for enlightening discussions about neutral-neutral reaction pathways.
References
- Aikawa, Y., Ohashi, N., & Herbst, E. 2003, ApJ, 593, 906 [NASA ADS] [CrossRef] [Google Scholar]
- André, P., Di Francesco, J., Ward-Thompson, D., et al. 2014, Protostars and Planets VI, 27 [Google Scholar]
- Avery, L. W., Broten, N. W., MacLeod, J. M., Oka, T., & Kroto, H. W. 1976, ApJ, 205, L173 [NASA ADS] [CrossRef] [Google Scholar]
- Avni, Y. 1976, ApJ, 210, 642 [NASA ADS] [CrossRef] [Google Scholar]
- Bacmann, A., Lefloch, B., Ceccarelli, C., et al. 2002, A&A, 389, L6 [NASA ADS] [CrossRef] [EDP Sciences] [Google Scholar]
- Bacmann, A., Lefloch, B., Ceccarelli, C., et al. 2003, ApJ, 585, L55 [NASA ADS] [CrossRef] [EDP Sciences] [Google Scholar]
- Bacmann, A., Caux, E., Hily-Blant, P., et al. 2010, A&A, 521, L42 [NASA ADS] [CrossRef] [EDP Sciences] [Google Scholar]
- Bacmann, A., Taquet, V., Faure, A., Kahane, C., & Ceccarelli, C. 2012, A&A, 541, L12 [NASA ADS] [CrossRef] [EDP Sciences] [Google Scholar]
- Balucani, N., Ceccarelli, C., & Taquet, V. 2015, MNRAS, 449, L16 [Google Scholar]
- Banerji, M., Viti, S., Williams, D. A., & Rawlings, J. M. C. 2009, ApJ, 692, 283 [NASA ADS] [CrossRef] [Google Scholar]
- Baulch, D. L., Bowman, C. T., Cobos, C. J., et al. 2005, J. Phys. Chem. Ref. Data, 34, 757 [NASA ADS] [CrossRef] [Google Scholar]
- Bizzocchi, L., Caselli, P., Spezzano, S., & Leonardo, E. 2014, A&A, 569, A27 [NASA ADS] [CrossRef] [EDP Sciences] [Google Scholar]
- Bottinelli, S., Ceccarelli, C., Neri, R., et al. 2004, ApJ, 617, L69 [NASA ADS] [CrossRef] [Google Scholar]
- Brady Ford, A., & Shirley, Y. L. 2011, ApJ, 728, 144 [NASA ADS] [CrossRef] [Google Scholar]
- Brown, R. D., Crofts, J. G., Godfrey, P. D., et al. 1975, ApJ, 197, L29 [NASA ADS] [CrossRef] [Google Scholar]
- Brown, P. D., Charnley, S. B., & Millar, T. J. 1988, MNRAS, 231, 409 [NASA ADS] [CrossRef] [Google Scholar]
- Caux, E., Kahane, C., Castets, A., et al. 2011, A&A, 532, A23 [NASA ADS] [CrossRef] [EDP Sciences] [Google Scholar]
- Cazaux, S., Tielens, A. G. G. M., Ceccarelli, C., et al. 2003, ApJ, 593, L51 [NASA ADS] [CrossRef] [Google Scholar]
- Cernicharo, J. 2012, in EPJ Web Conf., 34, 4002 [Google Scholar]
- Cernicharo, J., Marcelino, N., Roueff, E., et al. 2012, ApJ, 759, L43 [NASA ADS] [CrossRef] [Google Scholar]
- Charnley, S. B., Tielens, A. G. G. M., & Millar, T. J. 1992, ApJ, 399, L71 [NASA ADS] [CrossRef] [Google Scholar]
- Clary, D. C., Smith, D., & Adams, N. G. 1985, Chem. Phys. Lett., 119, 320 [NASA ADS] [CrossRef] [Google Scholar]
- Crapsi, A., Caselli, P., Walmsley, C. M., et al. 2005, ApJ, 619, 379 [Google Scholar]
- Crutcher, R. M. 1979, ApJ, 234, 881 [NASA ADS] [CrossRef] [Google Scholar]
- Dislaire, V., Hily-Blant, P., Faure, A., et al. 2012, A&A, 537, A20 [NASA ADS] [CrossRef] [EDP Sciences] [Google Scholar]
- Endo, Y., Saito, S., & Hirota, E. 1984, J. Chem. Phys., 81, 122 [NASA ADS] [CrossRef] [Google Scholar]
- Evans, N. J., Dunham, M. M., Jørgensen, J. K., et al. 2009, ApJS, 181, 321 [NASA ADS] [CrossRef] [Google Scholar]
- Faure, A., & Lique, F. 2012, MNRAS, 425, 740 [Google Scholar]
- Faure, A., Vuitton, V., Thissen, R., Wiesenfeld, L., & Dutuit, O. 2010, Farad. Discuss., 147, 337 [NASA ADS] [CrossRef] [Google Scholar]
- Faure, A., Hily-Blant, P., Gal, R. L., Rist, C., & Pineau Des Forêts, G. 2013, ApJ, 770, L2 [NASA ADS] [CrossRef] [Google Scholar]
- Flower, D. R., Pineau Des Forêts, G., & Walmsley, C. M. 2005, A&A, 436, 933 [NASA ADS] [CrossRef] [EDP Sciences] [Google Scholar]
- Flower, D. R., Pineau Des Forêts, G., & Walmsley, C. M. 2006, A&A, 449, 621 [NASA ADS] [CrossRef] [EDP Sciences] [Google Scholar]
- Frau, P., Girart, J. M., & Beltrán, M. T. 2012, A&A, 537, L9 [NASA ADS] [CrossRef] [EDP Sciences] [Google Scholar]
- Friberg, P., Hjalmarson, A., Madden, S. C., & Irvine, W. M. 1988, A&A, 195, 281 [Google Scholar]
- Garrod, R. T., & Herbst, E. 2006, A&A, 457, 927 [NASA ADS] [CrossRef] [EDP Sciences] [Google Scholar]
- Garrod, R., Park, I. H., Caselli, P., & Herbst, E. 2006, Farad. Discuss., 133, 51 [Google Scholar]
- Garrod, R. T., Wakelam, V., & Herbst, E. 2007, A&A, 467, 1103 [NASA ADS] [CrossRef] [EDP Sciences] [Google Scholar]
- Garrod, R. T., Weaver, S. L. W., & Herbst, E. 2008, ApJ, 682, 283 [NASA ADS] [CrossRef] [Google Scholar]
- Geppert, W. D., Hamberg, M., Thomas, R. D., et al. 2006, Farad. Discuss., 133, 177 [Google Scholar]
- Gerin, M., Goicoechea, J. R., Pety, J., & Hily-Blant, P. 2009, A&A, 494, 977 [NASA ADS] [CrossRef] [EDP Sciences] [Google Scholar]
- Goldsmith, P. F., & Li, D. 2005, ApJ, 622, 938 [NASA ADS] [CrossRef] [Google Scholar]
- Gómez Martín, J., Caravan, R., Blitz, M., Heard, D., & Plane, J. 2014, J. Phys. Chem. A, 118, 2693 [CrossRef] [Google Scholar]
- Gottlieb, C. A. 1973, in Molecules in the Galactic Environment, eds. M. A. Gordon, & L. E. Snyder, 181 [Google Scholar]
- Gutman, D., Sanders, N., & Butler, J. E. 1982, J. Phys. Chem., 86, 66 [CrossRef] [Google Scholar]
- Guzmán, V. V., Goicoechea, J. R., Pety, J., et al. 2013, A&A, 560, A73 [NASA ADS] [CrossRef] [EDP Sciences] [Google Scholar]
- Hamberg, M., Geppert, W. D., Thomas, R. D., et al. 2007, Mol. Phys., 105, 899 [NASA ADS] [CrossRef] [Google Scholar]
- Hasegawa, T. I., & Herbst, E. 1993, MNRAS, 263, 589 [NASA ADS] [CrossRef] [Google Scholar]
- Hily-Blant, P., Pineau Des Forêts, G., Faure, A., Gal, R. L., & Padovani, M. 2013, A&A, 557, A65 [NASA ADS] [CrossRef] [EDP Sciences] [Google Scholar]
- Horn, A., Møllendal, H., Sekiguchi, O., et al. 2004, ApJ, 611, 605 [NASA ADS] [CrossRef] [Google Scholar]
- Li, D., & Goldsmith, P. F. 2003, ApJ, 585, 823 [NASA ADS] [CrossRef] [Google Scholar]
- Loinard, L., Castets, A., Ceccarelli, C., et al. 2000, A&A, 359, 1169 [NASA ADS] [Google Scholar]
- Loison, J.-C., Wakelam, V., Hickson, K. M., Bergeat, A., & Mereau, R. 2014, MNRAS, 437, 930 [NASA ADS] [CrossRef] [Google Scholar]
- McElroy, D., Walsh, C., Markwick, A. J., et al. 2013, A&A, 550, A36 [NASA ADS] [CrossRef] [EDP Sciences] [Google Scholar]
- Müller, H. S. P., Thorwirth, S., Roth, D. A., & Winnewisser, G. 2001, A&A, 370, L49 [NASA ADS] [CrossRef] [EDP Sciences] [Google Scholar]
- Müller, H. S. P., Menten, K. M., & Mäder, H. 2004, A&A, 428, 1019 [NASA ADS] [CrossRef] [EDP Sciences] [Google Scholar]
- Müller, H. S. P., Schlöder, F., Stutzki, J., & Winnewisser, G. 2005, J. Mol. Struct., 742, 215 [NASA ADS] [CrossRef] [Google Scholar]
- Ohishi, M., Ishikawa, S.-I., Amano, T., et al. 1996, ApJ, 471,L61 [NASA ADS] [CrossRef] [Google Scholar]
- Osamura, Y., Roberts, H., & Herbst, E. 2005, ApJ, 621, 348 [NASA ADS] [CrossRef] [Google Scholar]
- Padovani, M., Walmsley, C. M., Tafalla, M., Hily-Blant, P., & Pineau Des Forêts, G. 2011, A&A, 534, A77 [NASA ADS] [CrossRef] [EDP Sciences] [Google Scholar]
- Pagani, L., Vastel, C., Hugo, E., et al. 2009, A&A, 494, 623 [NASA ADS] [CrossRef] [EDP Sciences] [Google Scholar]
- Palmer, P., Zuckerman, B., Buhl, D., & Snyder, L. E. 1969, ApJ, 156, L147 [NASA ADS] [CrossRef] [Google Scholar]
- Parise, B., Castets, A., Herbst, E., et al. 2004, A&A, 416, 159 [NASA ADS] [CrossRef] [EDP Sciences] [Google Scholar]
- Peters, P. S., Duflot, D., Wiesenfeld, L., & Toubin, C. 2013, J. Chem. Phys., 139, 4310 [NASA ADS] [Google Scholar]
- Pickett, H. M., Poynter, R. L., Cohen, E. A., et al. 1998, J. Quant. Spectr. Radiat. Trans., 60, 883 [Google Scholar]
- Pirim, C., & Krim, L. 2011a, Chem. Phys., 380, 67 [NASA ADS] [CrossRef] [Google Scholar]
- Pirim, C., & Krim, L. 2011b, Phys. Chem. Chem. Phys., 13, 19454 [CrossRef] [Google Scholar]
- Pirim, C., Krim, L., Laffon, C., et al. 2010, J. Phys. Chem. A, 114, 3320 [CrossRef] [Google Scholar]
- Rabli, D., & Flower, D. R. 2010, MNRAS, 406, 95 [NASA ADS] [CrossRef] [Google Scholar]
- Roy, A., André, P., Palmeirim, P., et al. 2014, A&A, 562, A138 [NASA ADS] [CrossRef] [EDP Sciences] [Google Scholar]
- Ruaud, M., Loison, J. C., Hickson, K. M., et al. 2015, MNRAS, 447, 4004 [NASA ADS] [CrossRef] [Google Scholar]
- Saito, S. 1972, ApJ, 178, L95 [NASA ADS] [CrossRef] [Google Scholar]
- Sayah, N., Li, X., Caballero, J., & Jackson, W. 1988, J. Photochem. Photobiol. A, 45, 177 [CrossRef] [Google Scholar]
- Schenewerk, M. S., Jewell, P. R., Snyder, L. E., Hollis, J. M., & Ziurys, L. M. 1988, ApJ, 328, 785 [NASA ADS] [CrossRef] [Google Scholar]
- Schöier, F. L., Jørgensen, J. K., Dishoeck, E. F. V., & Blake, G. A. 2002, A&A, 390, 1001 [NASA ADS] [CrossRef] [EDP Sciences] [Google Scholar]
- Shannon, R. J., Blitz, M. A., Goddard, A., & Heard, D. E. 2013, Nat. Chem., 5, 745 [NASA ADS] [CrossRef] [Google Scholar]
- Shannon, R. J., Cossou, C., Loison, J.-C., et al. 2014, RSC Adv., 4, 26342 [CrossRef] [Google Scholar]
- Sims, I. R., Queffelec, J.-L., Defrance, A., et al. 1994, J. Chem. Phys., 100, 4229 [NASA ADS] [CrossRef] [Google Scholar]
- Snyder, L. E., Hollis, J. M., & Ulich, B. L. 1976, ApJ, 208, L91 [NASA ADS] [CrossRef] [Google Scholar]
- Tafalla, M., & Santiago, J. 2004, A&A, 414, L53 [Google Scholar]
- Tafalla, M., Myers, P. C., Caselli, P., & Walmsley, C. M. 2004, A&A, 416, 191 [NASA ADS] [CrossRef] [EDP Sciences] [Google Scholar]
- Tafalla, M., Santiago-García, J., Myers, P. C., et al. 2006, A&A, 455, 577 [NASA ADS] [CrossRef] [EDP Sciences] [Google Scholar]
- Taquet, V., Ceccarelli, C., & Kahane, C. 2012, A&A, 538, A42 [NASA ADS] [CrossRef] [EDP Sciences] [Google Scholar]
- Tielens, A. G. G. M. 2010, The Physics and Chemistry of the Interstellar Medium ed. A. G. G. M. Tielens (UK: Cambridge University Press) [Google Scholar]
- Tielens, A. G. G. M., & Hagen, W. 1982, A&A, 114, 245 [NASA ADS] [Google Scholar]
- Townes, C. H., & Cheung, A. C. 1969, ApJ, 157, L103 [NASA ADS] [CrossRef] [Google Scholar]
- Troland, T. H., & Crutcher, R. M. 2008, ApJ, 680, 457 [NASA ADS] [CrossRef] [Google Scholar]
- Tucker, K. D., Kutner, M. L., & Thaddeus, P. 1974, ApJ, 193, L115 [NASA ADS] [CrossRef] [Google Scholar]
- van der Tak, F. F. S., Black, J. H., Schöier, F. L., Jansen, D. J., & Dishoeck, E. F. V. 2007, A&A, 468, 627 [NASA ADS] [CrossRef] [EDP Sciences] [Google Scholar]
- van Dishoeck, E. F., Blake, G. A., Jansen, D. J., & Groesbeck, T. D. 1995, ApJ, 447, 760 [NASA ADS] [CrossRef] [Google Scholar]
- Vastel, C., Ceccarelli, C., Lefloch, B., & Bachiller, R. 2014, ApJ, 795, L2 [Google Scholar]
- Vasyunin, A. I., & Herbst, E. 2013, ApJ, 769, 34 [Google Scholar]
- Wakelam, V., Herbst, E., Loison, J.-C., et al. 2012, ApJS, 199, 21 [NASA ADS] [CrossRef] [Google Scholar]
- Wang, T., & Bowie, J. H. 2012, Org. Biomol. Chem., 10, 3219 [CrossRef] [Google Scholar]
- Wang, H. Y., Eyre, J. A., & Dorfman, L. M. 1973, J. Chem. Phys., 59, 5199 [NASA ADS] [CrossRef] [Google Scholar]
- Watanabe, N., & Kouchi, A. 2002, ApJ, 571, L173 [NASA ADS] [CrossRef] [Google Scholar]
- Xu, L.-H., & Lovas, F. J. 1997, J. Phys. Chem. Ref. Data, 26, 17 [NASA ADS] [CrossRef] [Google Scholar]
Appendix A: The “locked dipole” approximation
Our simple steady-state chemical model (detailed in Sects. 4.2 and 4.3) is subtantially based on the loss of HCO, H2CO, CH3O and CH3OH by reactions with H. To the best of our knowledge, the corresponding rate coefficients have not been measured experimentally. It should be noted that the dipole moments of these species are quite large: 1.53 D for HCO, 2.33 D for H2CO, 2.12 D for CH3O and 1.67 D for CH3OH (JPL catalog). The rates are therefore expected to significantly exceed the Langevin rate of ~10-9 cm3 s-1. Several theoretical studies have shown, however, that the contribution of the ion dipole interaction is difficult to estimate (see Faure et al. 2010, and
Appendix B: Additional tables
Line parameters for HCO.
references therein). In the case of the similar HCN+H reaction, the popular inifinite-order sudden (IOS) and average-dipole-orientation (ADO) theories were found to underestimate the rate coefficient at low temperature by large factors (Clary et al. 1985). For such polar systems with relatively large rotational constants (B ≳ 1 cm-1), the “locked dipole” approximation provides better results in the low temperature regime because the short rotational period allows dipole alignment. Indeed, for a typical rate coefficients of 5 × 10⁻⁸ cm3 s-1, one can estimate an interaction time of tint ~ 30 ps at 10 K, which is similar or larger than the typical rotational periods. The locked-dipole formula can be found e.g. in Eq. (1) of Faure et al. (2010). The corresponding values for the rate coefficients at 10 K are given in Table 8.
Line parameters for CH3O.
Line parameters for CH3OH.
All Tables
Molecular transitions observed, with their frequencies, upper-level energies Eup, upper-level degeneracy gup, Einstein spontaneous emission coefficient Aul.
List of reactions and adopted rates at 10 K and adopted branching ratios for reactions with several output channels.
Line parameters for HCO observations in the protostellar source IRAS 16 293-2422.
All Figures
|
Fig. 1 HCO spectra in L1689B. The vertical dashed lines indicate the positions of the HCO transitions. |
| In the text | |
|
Fig. 2 CH3O spectra in L1689B. The vertical dashed lines indicate the positions of the CH3O transitions. |
| In the text | |
|
Fig. 3 CH3OH spectra in L1689B. The vertical dashed lines indicate the positions of the CH3OH transitions. Channels appearing as absorption features arising from the frequency-switching observing procedure were blanked for clarity. |
| In the text | |
Current usage metrics show cumulative count of Article Views (full-text article views including HTML views, PDF and ePub downloads, according to the available data) and Abstracts Views on Vision4Press platform.
Data correspond to usage on the plateform after 2015. The current usage metrics is available 48-96 hours after online publication and is updated daily on week days.
Initial download of the metrics may take a while.