Fig. B.1
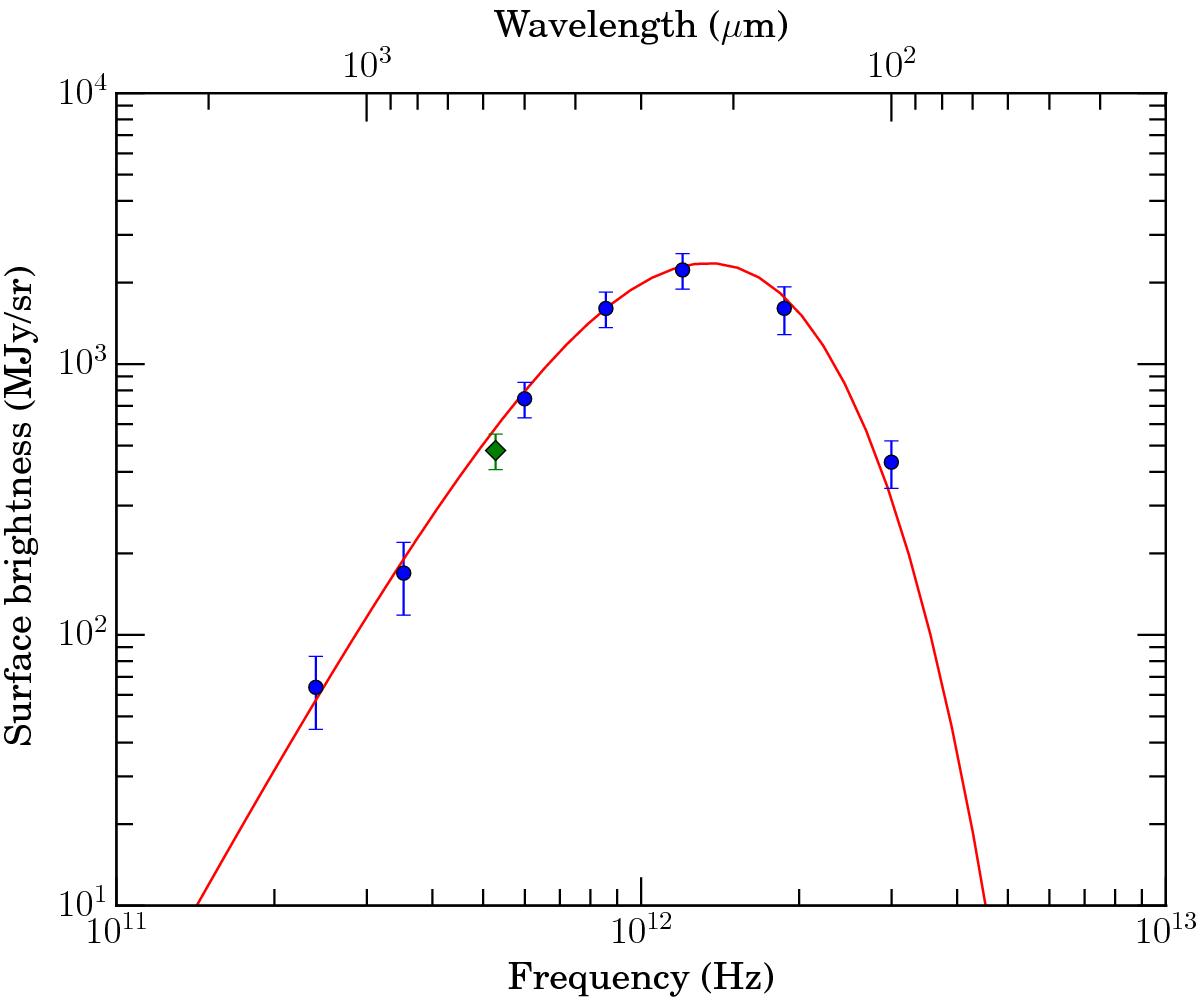
Spectral energy distribution of 16293E. The round blue dots are measurements from the continuum maps (PACS at 160 μm, SPIRE at 250, 350, and 500 μm, SCUBA-2 at 850 μm and MPIfR bolometre at 1.3 mm), the green diamond is the continuum measured on the ND spectrum. The red line is a modified blackbody law with a temperature of 14 K, an H2 column density of 1.66 × 1023 cm-3, and a dust emissivity spectral index β of 1.7.
Current usage metrics show cumulative count of Article Views (full-text article views including HTML views, PDF and ePub downloads, according to the available data) and Abstracts Views on Vision4Press platform.
Data correspond to usage on the plateform after 2015. The current usage metrics is available 48-96 hours after online publication and is updated daily on week days.
Initial download of the metrics may take a while.