Fig. 5
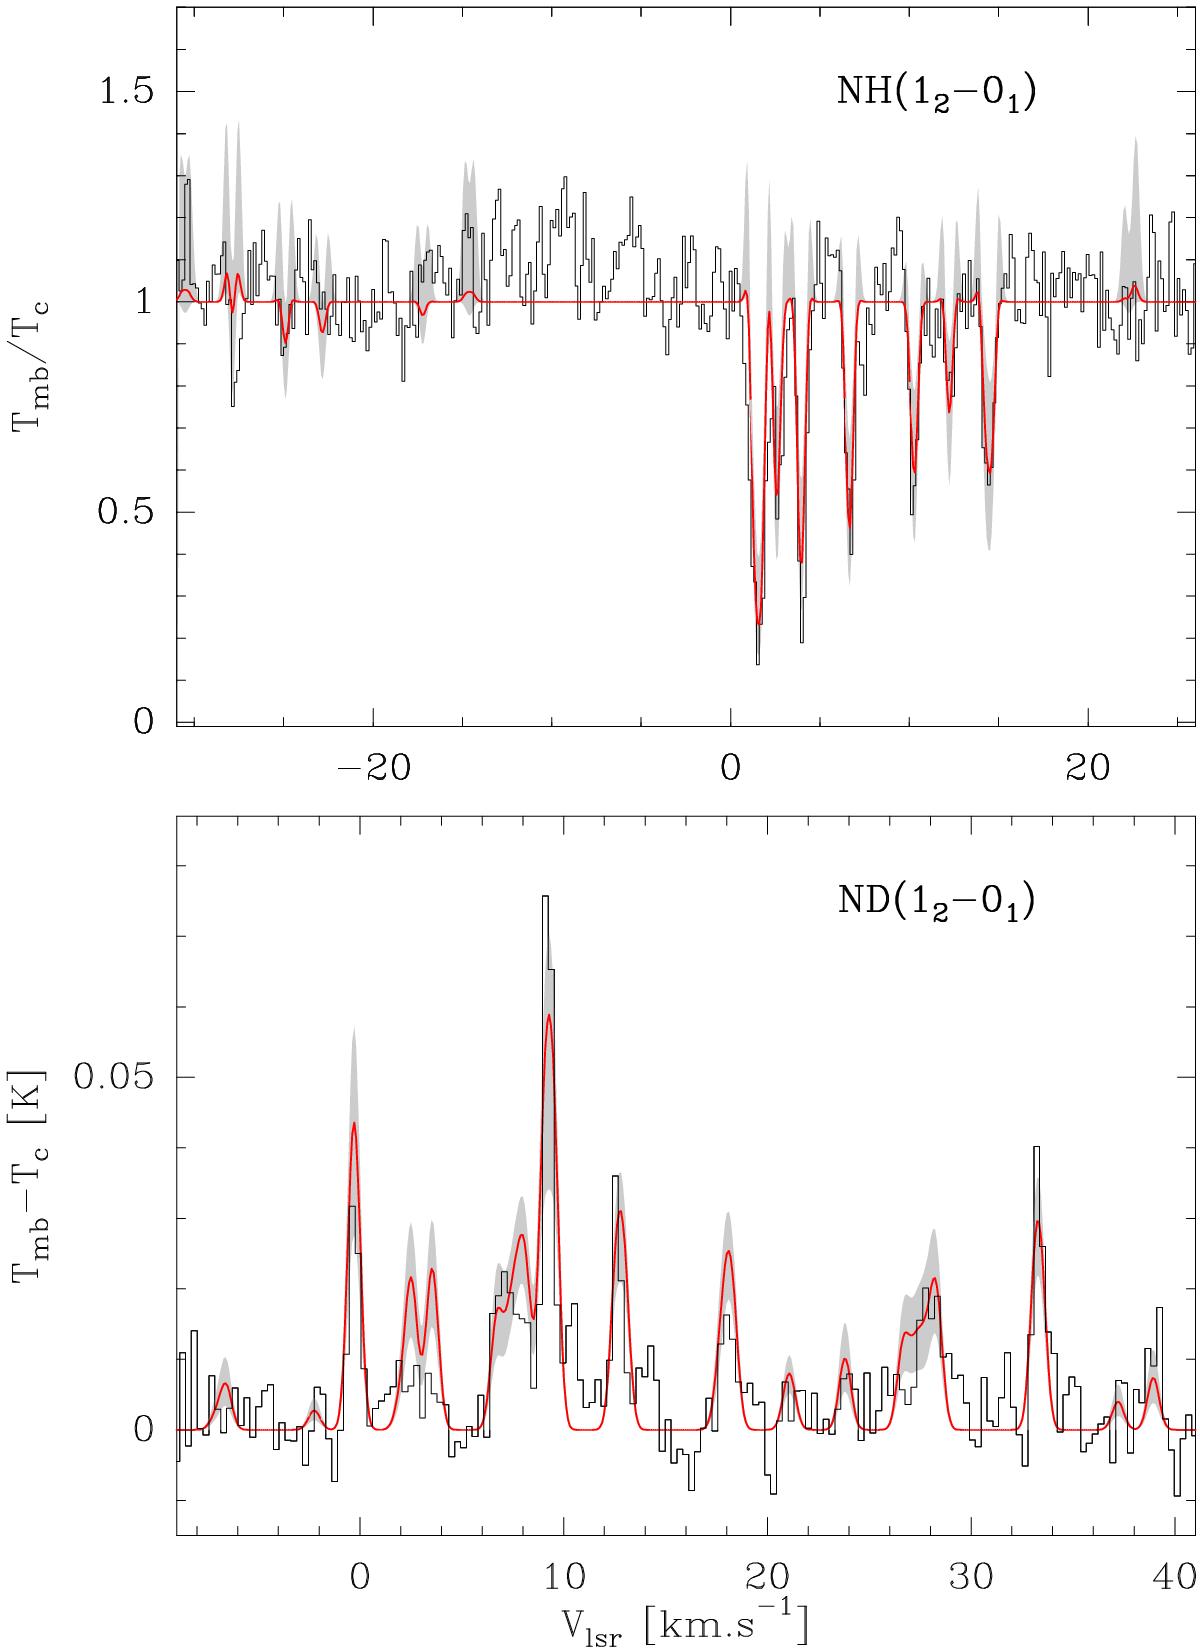
Best-fit model (red line) of the non local, non-LTE radiative transfer analysis, superimposed on the observed spectrum (black line). The grey area represents the range of synthetic spectra consistent with the observations. The continuum level Tc has been subtracted from the ND spectrum. The NH spectrum is shown divided by the continuum level Tc.
Current usage metrics show cumulative count of Article Views (full-text article views including HTML views, PDF and ePub downloads, according to the available data) and Abstracts Views on Vision4Press platform.
Data correspond to usage on the plateform after 2015. The current usage metrics is available 48-96 hours after online publication and is updated daily on week days.
Initial download of the metrics may take a while.