Free Access
Fig. 9
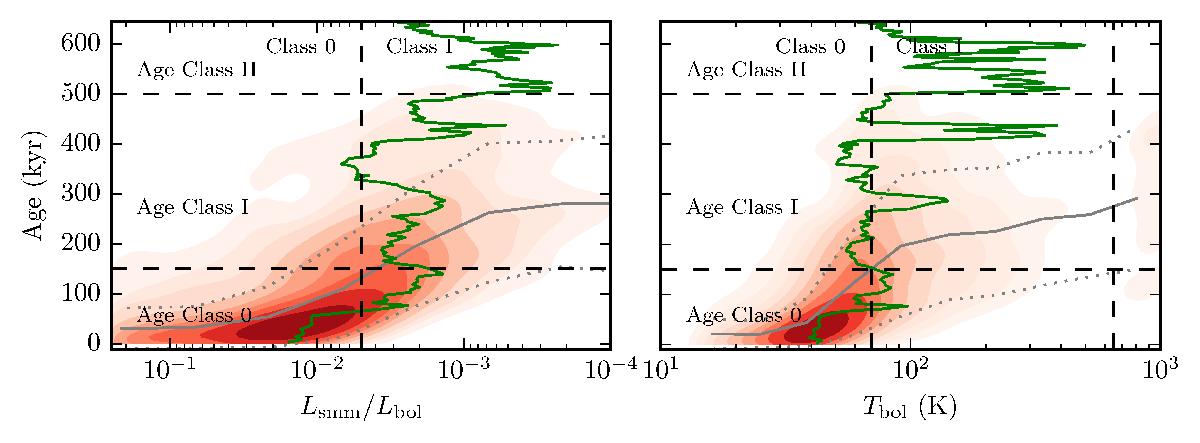
Lsmm/Lbol and Tbol vs. protostellar age. See Table 5 for the fraction of points recorded in each quadrant. The green line shows the evolution of one protostar, which grows to a final mass of 3.6 M⊙. The grey line is a binned median of the data, and the dotted lines indicate the one sigma uncertainties.
Current usage metrics show cumulative count of Article Views (full-text article views including HTML views, PDF and ePub downloads, according to the available data) and Abstracts Views on Vision4Press platform.
Data correspond to usage on the plateform after 2015. The current usage metrics is available 48-96 hours after online publication and is updated daily on week days.
Initial download of the metrics may take a while.