Fig. 5
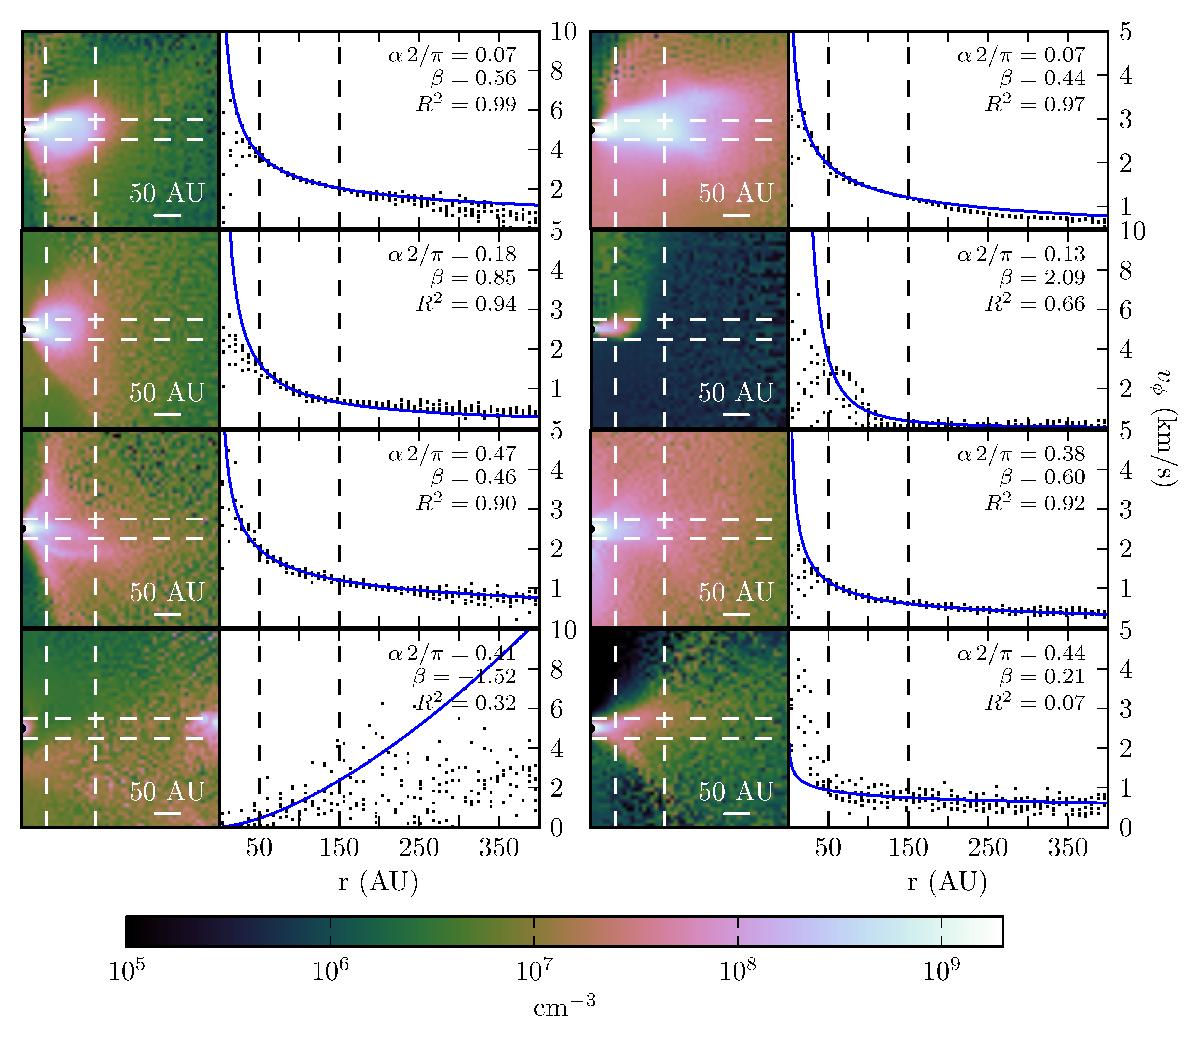
Examples of disks in the simulation. The dashed lines indicate the regions used for fitting the rotation curves for the power law method. The blue solid line in each panel is the best fitting power law. In the top right corner of each panel is given the angle α, R2, and the power law index, β. Top row: systems that are disks by both the α-angle and the power law method. Second row: disks by the α-angle method, but not by the power law method. Third row: disks by the power law method, but not by the α-angle method. Bottom row: disks by neither method.
Current usage metrics show cumulative count of Article Views (full-text article views including HTML views, PDF and ePub downloads, according to the available data) and Abstracts Views on Vision4Press platform.
Data correspond to usage on the plateform after 2015. The current usage metrics is available 48-96 hours after online publication and is updated daily on week days.
Initial download of the metrics may take a while.