Fig. 2
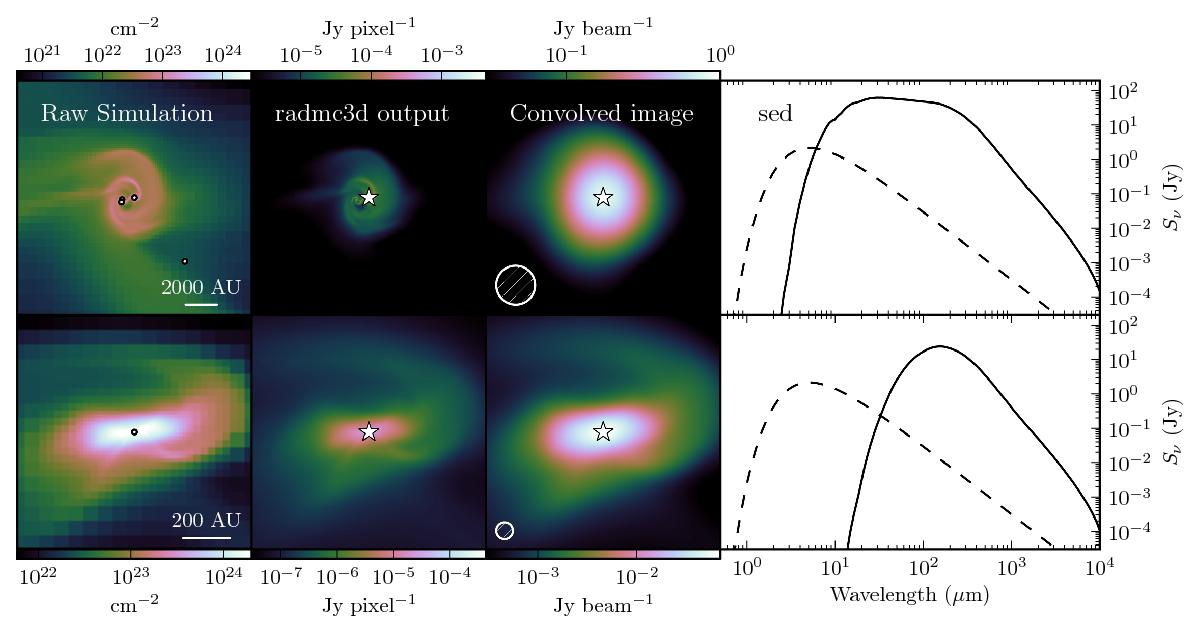
From raw simulation to synthetic observables for two different systems. From left to right: projected gas column density from the raw simulation, with dots indicating protostars; 850 μmRADMC-3D continuum images; continuum images after convolving with a Gaussian beam (top: 15′′, bottom: 0.5′′); SEDs of the systems, the dashed lines are the SEDs of the central protostars. The assumed distance to both systems is 125 pc.
Current usage metrics show cumulative count of Article Views (full-text article views including HTML views, PDF and ePub downloads, according to the available data) and Abstracts Views on Vision4Press platform.
Data correspond to usage on the plateform after 2015. The current usage metrics is available 48-96 hours after online publication and is updated daily on week days.
Initial download of the metrics may take a while.