Free Access
Fig. 14
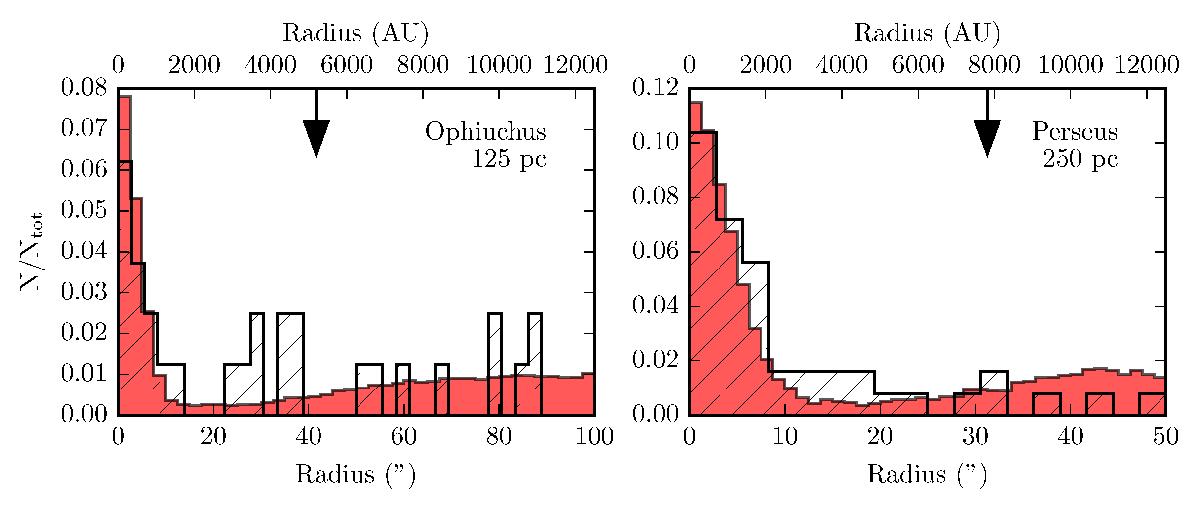
Distribution of distances between cores and their nearest protostar in the simulation (shaded histograms), and from observations of Ophiuchus and Perseus (hatched histograms). The black arrows indicate the average core radius in the simulation.
Current usage metrics show cumulative count of Article Views (full-text article views including HTML views, PDF and ePub downloads, according to the available data) and Abstracts Views on Vision4Press platform.
Data correspond to usage on the plateform after 2015. The current usage metrics is available 48-96 hours after online publication and is updated daily on week days.
Initial download of the metrics may take a while.