Fig. 13
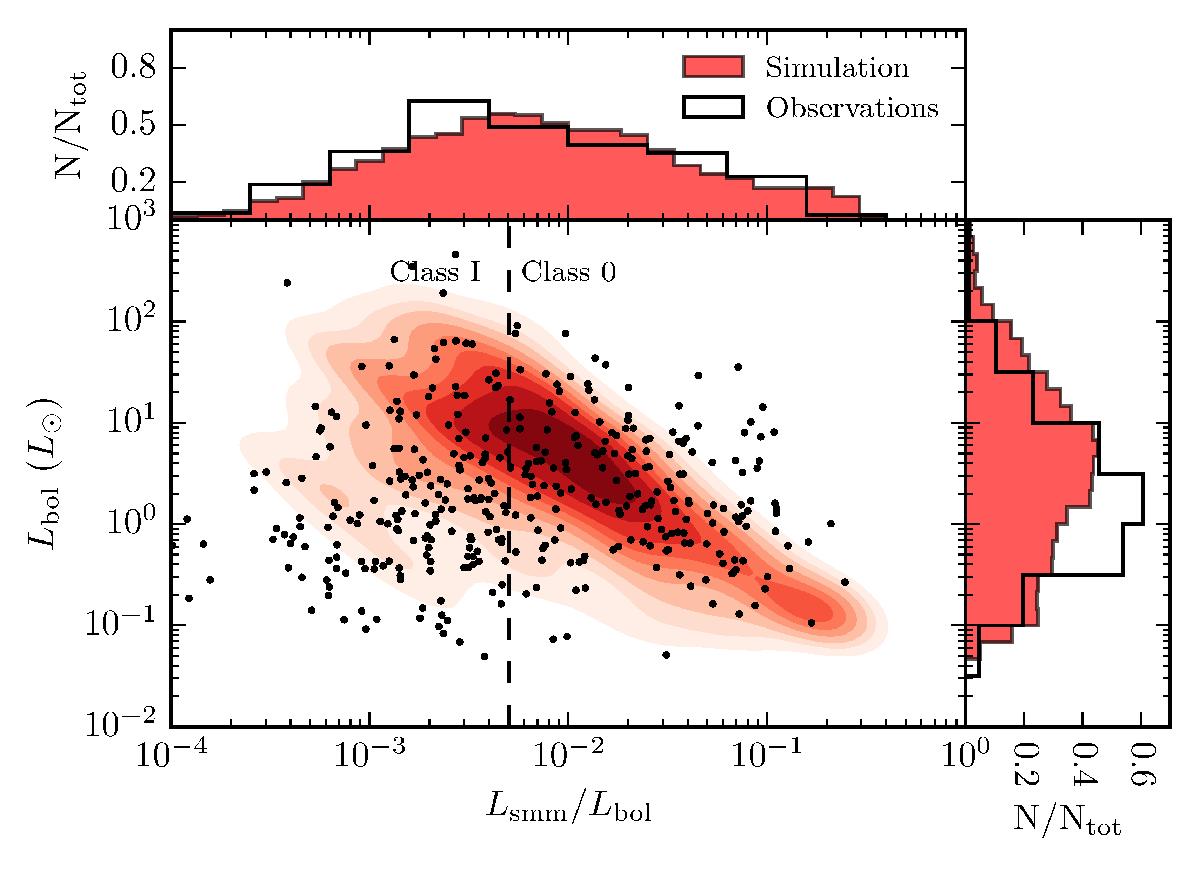
Distribution of Lbol and Lsmm/Lbol, for the protostars in the simulation (red contours), and observations (black dots). The marginal distributions of each variable are shown at the edges. The observational data is the same, as was used in Fig. 6. Median luminosities of both simulation and observations are recorded in Table 6.
Current usage metrics show cumulative count of Article Views (full-text article views including HTML views, PDF and ePub downloads, according to the available data) and Abstracts Views on Vision4Press platform.
Data correspond to usage on the plateform after 2015. The current usage metrics is available 48-96 hours after online publication and is updated daily on week days.
Initial download of the metrics may take a while.