Fig. 12
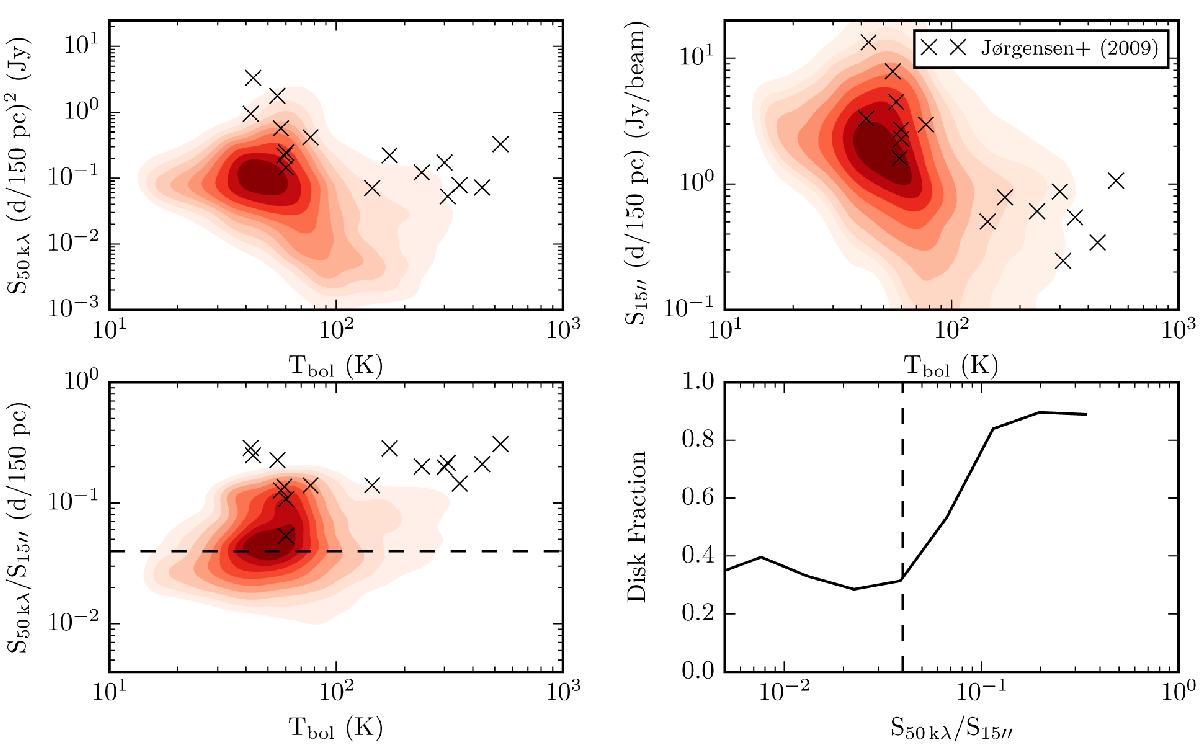
Top left: compact fluxes from the simulation compared directly to 1.1 mm SMA observations. Top right: extended fluxes from the simulation compared directly to 0.85 mm SCUBA observations. The fluxes have been rescaled to a common distance of 150 pc. For the interferometric fluxes this is just the inverse square law F ∝ d-2. For the single-dish fluxes we follow Jørgensen et al. (2009) who, based on a density profile corresponding to a free-falling envelope (ρ ∝ r-1.5), found F ∝ d-1. Bottom left: flux ratios. The horizontal dashed line corresponds to the flux ratio expected for pure envelope emission (Jørgensen et al. 2009). Bottom right: disk fraction vs. flux ratio. The solid line is the fraction of systems which contains a disk in each bin. The vertical dashed line is the same as the horizontal dashed line in the lower left panel.
Current usage metrics show cumulative count of Article Views (full-text article views including HTML views, PDF and ePub downloads, according to the available data) and Abstracts Views on Vision4Press platform.
Data correspond to usage on the plateform after 2015. The current usage metrics is available 48-96 hours after online publication and is updated daily on week days.
Initial download of the metrics may take a while.