Fig. 10
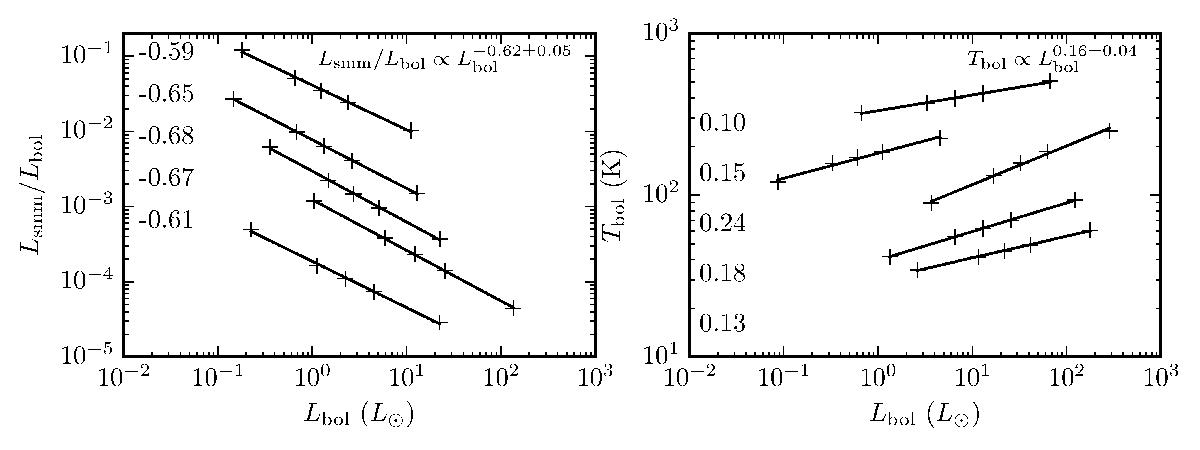
Dependence of Lsmm/Lbol and Tbol on Lbol. The solid lines are power law fits to individual systems, and the numbers indicate the exponents of the fits. The results after fitting all 200 protostars in the sub-sample are shown in the upper right corner. The objects shown in the figure have been chosen to show the dependence on Lbol for a wide range of Lsmm/Lbol and Tbol values.
Current usage metrics show cumulative count of Article Views (full-text article views including HTML views, PDF and ePub downloads, according to the available data) and Abstracts Views on Vision4Press platform.
Data correspond to usage on the plateform after 2015. The current usage metrics is available 48-96 hours after online publication and is updated daily on week days.
Initial download of the metrics may take a while.