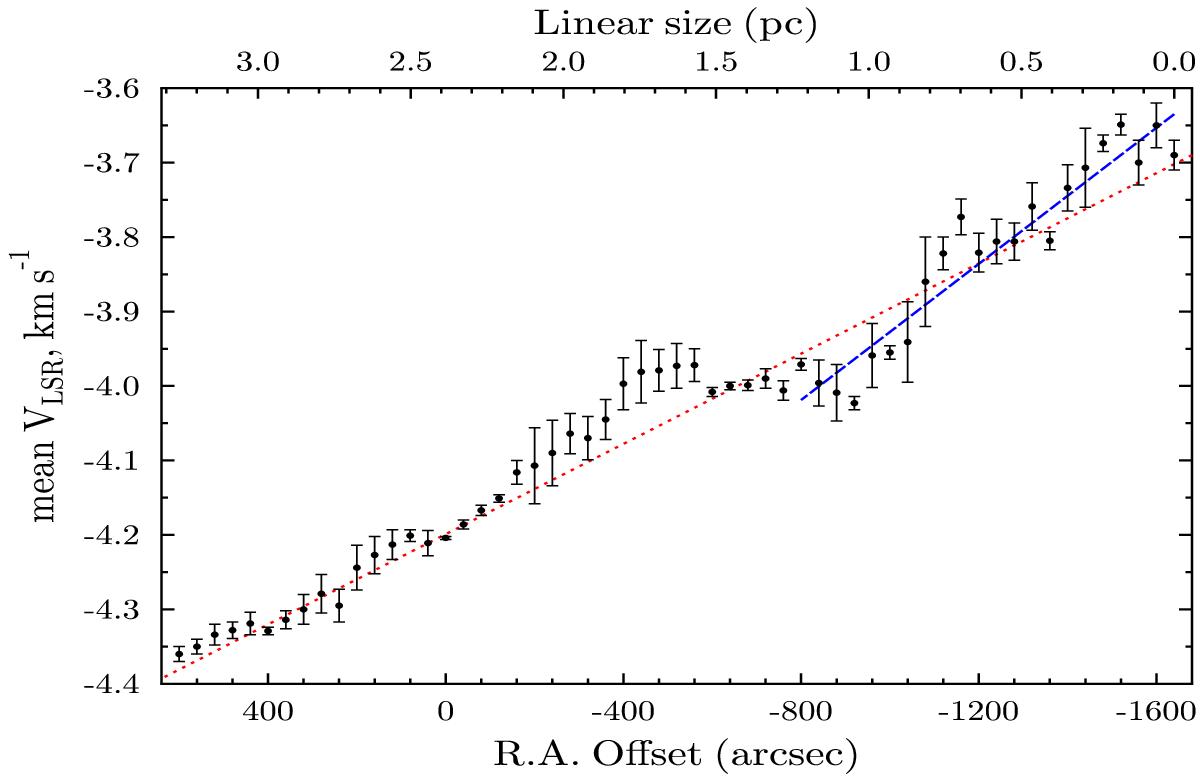
Fig. 7

Position-velocity diagram of NH3(1, 1) along the direction of the velocity gradient (E → W). At each offset Δα, the measured centroid velocities (VLSR) are averaged across the filament in the direction S → N. The error bars (the standard deviation of the mean) result from this averaging. The different positions were weighted inversely proportional to the variance. The linear regression for the total range is shown by red: V0 = −4.199(1)−0.000303(3)Δα (km s-1) (here Δα is in arcsec). For the αβ condensation (−480″ ≤ Δα ≤ 600″), the regression line is practically the same. For the γ condensation (−1640″ ≤ Δα ≤ −800″), it is shown by a blue line with V0 = − 4.38(1) −0.00046(1)Δα (km s-1). The number in parentheses is the one-sigma (1σ) uncertainty in the last digit of the given value. The (0, 0) map position is as in Fig. 1.
Current usage metrics show cumulative count of Article Views (full-text article views including HTML views, PDF and ePub downloads, according to the available data) and Abstracts Views on Vision4Press platform.
Data correspond to usage on the plateform after 2015. The current usage metrics is available 48-96 hours after online publication and is updated daily on week days.
Initial download of the metrics may take a while.


