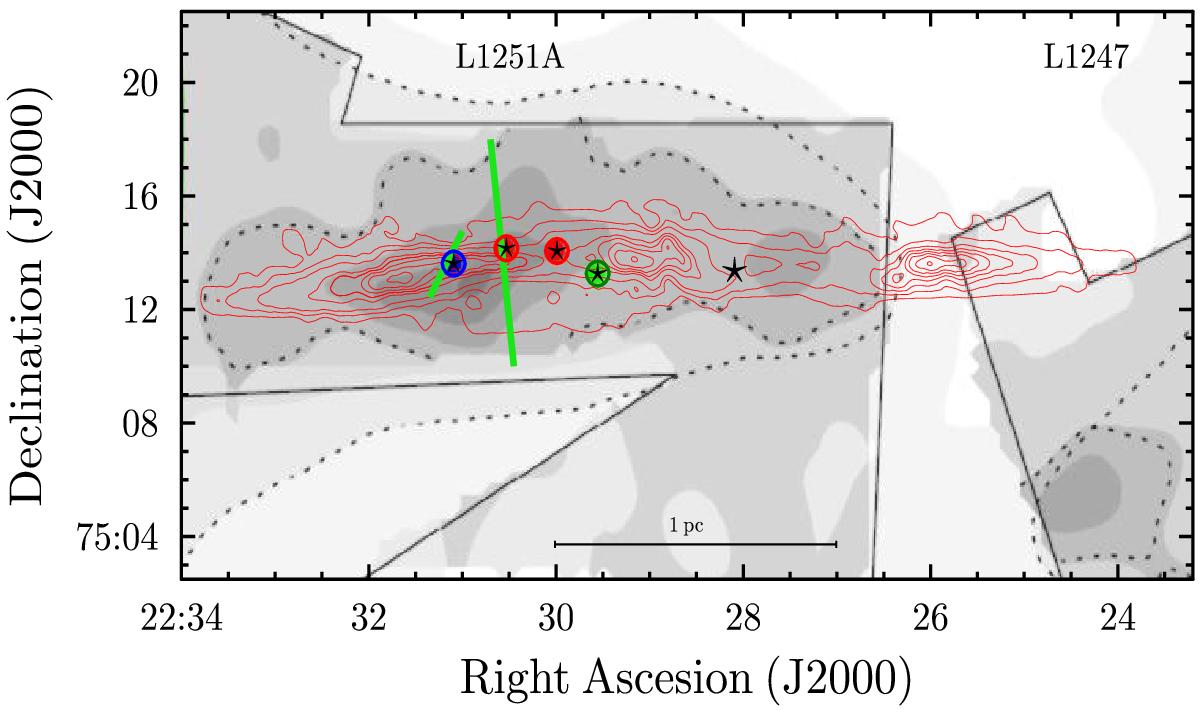
Fig. 5

Portion of Fig. 17 from Kirk et al. (2009) with extended structure toward L1251A and L1247. The gray scale shows the distribution of visual extinction as derived from the Digitized Sky Survey (Dobashi et al. 2005), and the superimposed higher resolution extinction maps (outlined by solid straight black lines) observed with the Spitzer Infrared Array Camera (IRAC; 3.6–8.0 μm) and Multiband Imaging Photometer (MIPS; 24–160 μm). Two dashed lines refer to Dobashi AV = 1 mag and Spitzer AV = 5 mag. The colored markers show the location and spectral type of the young stellar object (YSO) candidates: red/green/blue for Class I/Flat/Class II. The black stars are the same markers as in Fig. 2b. The NH3(1, 1) integrated intensity map, as in Fig. 4, is denoted by the red contours. The approximate orientation and linear size of a jet extending about 10′ and a small bipolar nebula to the east of the jet (solid green lines) are copied from Fig. 1 in Lee et al. (2010).
Current usage metrics show cumulative count of Article Views (full-text article views including HTML views, PDF and ePub downloads, according to the available data) and Abstracts Views on Vision4Press platform.
Data correspond to usage on the plateform after 2015. The current usage metrics is available 48-96 hours after online publication and is updated daily on week days.
Initial download of the metrics may take a while.


