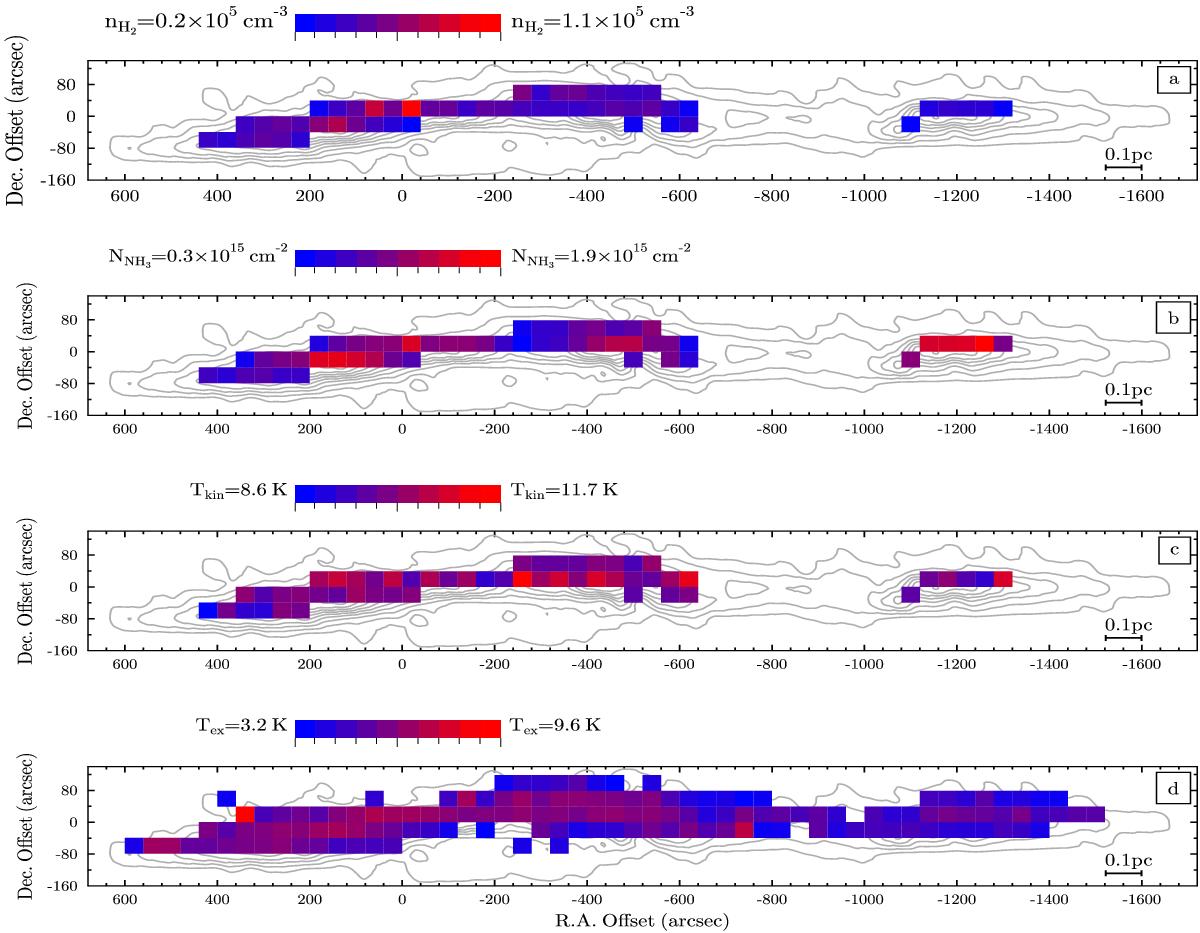
Fig. 3

Distributions of the measured parameters in L1251A: a) the gas volume density, nH2; b) the NH3 column density, NNH3; c) the kinetic temperature, Tkin; and (d) the excitation temperature, Tex. Three parameters nH2, NNH3, and Tkin were measured at the 54 positions where both the NH3(1, 1) and (2, 2) lines were observed, whereas Tex was estimated from the NH3(1, 1) lines, which are not very weak. Each color box has a size of 40′′×40′′ and its bottom left corner corresponds to the telescope pointing. The contours are the NH3(1, 1) integrated intensity map. The starting point for the contour levels is 0.2 K km s-1; the increment is 1.0 K km s-1. The (0, 0) map position is as in Fig. 1. We note that for the beam filling factor η< 1, certain parameters could be larger (see Sects. 3 and 3.1 for details).
Current usage metrics show cumulative count of Article Views (full-text article views including HTML views, PDF and ePub downloads, according to the available data) and Abstracts Views on Vision4Press platform.
Data correspond to usage on the plateform after 2015. The current usage metrics is available 48-96 hours after online publication and is updated daily on week days.
Initial download of the metrics may take a while.


