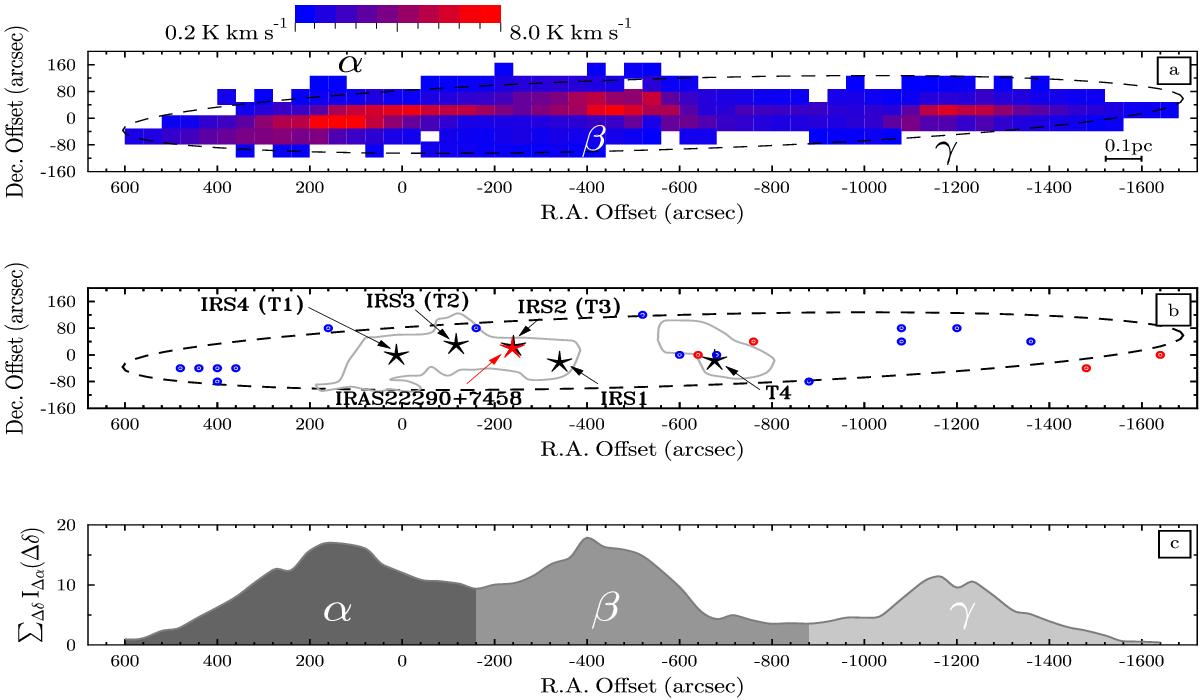
Fig. 2

a) NH3(1, 1) integrated intensity map (∫TMBdv in units of K km s-1) of the molecular core L1251A. Each color box has a size of 40′′ × 40′′, and its bottom left corner corresponds to the telescope pointing. The parameters of the NH3 peaks α,β, and γ are given in Table 1. The core exhibits a filamentary structure that can be enveloped by an ellipse (dashed line) with principal axes of 1140′′ and 89′′. b) Schematic configuration of the filament and peak positions of the ammonia cores T1–T4. The gray contours restrict ammonia emission to the lowest level of the integrated NH3(1, 1) emission as in Fig. 3 in Tóth & Walmsley (1996). The location of the IRS sources are from Lee et al. (2010). The red star is the IR source detected by IRAS. The filled blue and red circles outline areas of the narrowest ammonia lines with FWHP line widths of, respectively, Δv ~ 0.2 km s-1, and ~0.1 km s-1; their offsets are listed in Table 1. c) The sum over the integrated intensities for a given RA, ∑ ΔδIΔα(Δδ). The (0, 0) map position and the distance to the source are as in Fig. 1.
Current usage metrics show cumulative count of Article Views (full-text article views including HTML views, PDF and ePub downloads, according to the available data) and Abstracts Views on Vision4Press platform.
Data correspond to usage on the plateform after 2015. The current usage metrics is available 48-96 hours after online publication and is updated daily on week days.
Initial download of the metrics may take a while.


