Fig. 6
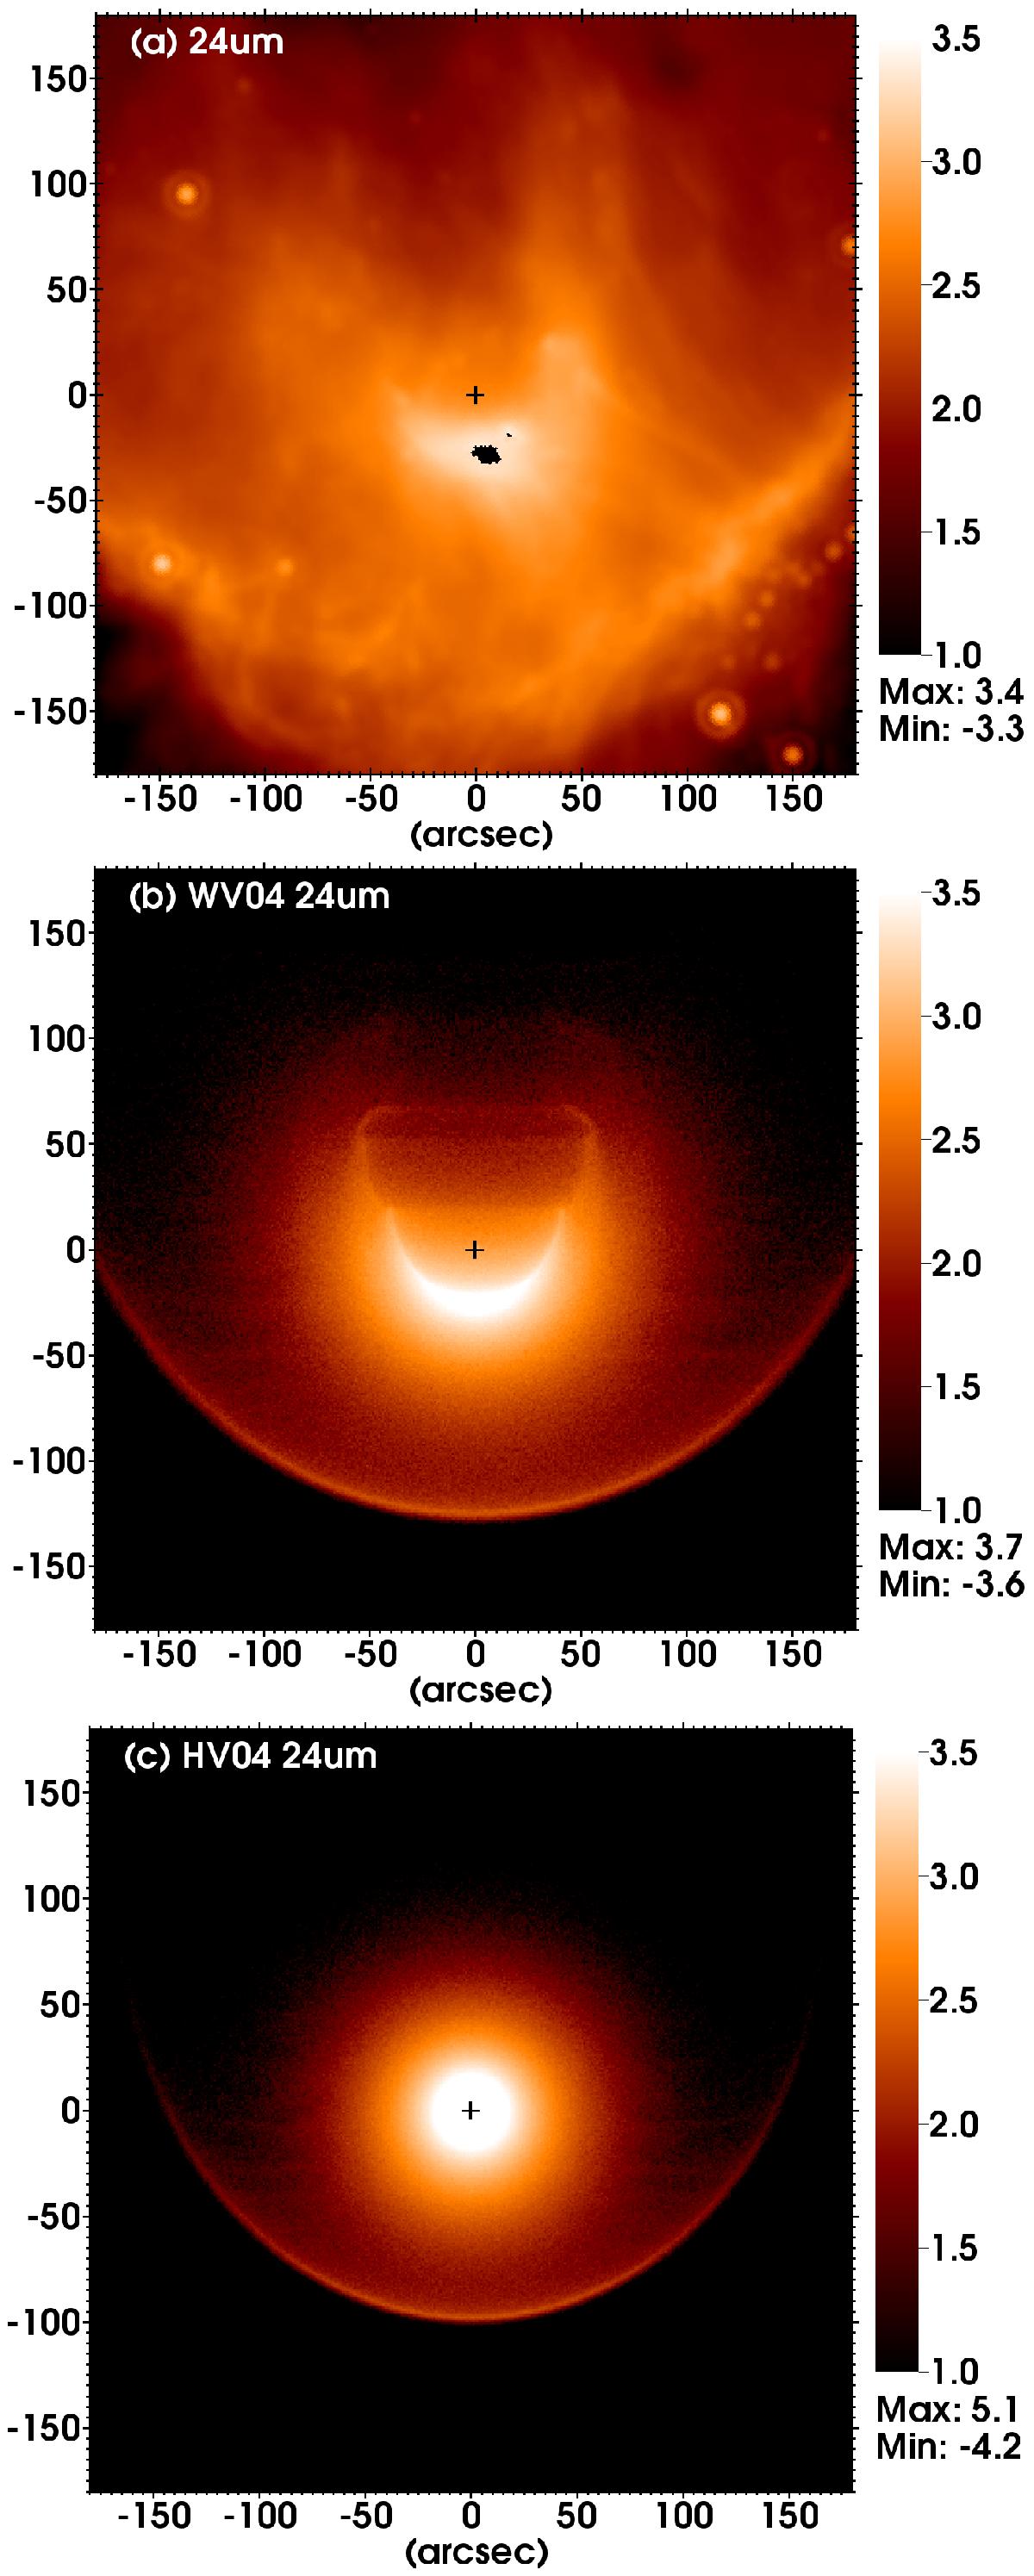
a) Galactic H ii region RCW 120 in the mid-IR from Spitzer at 24 μm. A dark spot below the position of the star is from saturated pixels. b) Synthetic observation at 24 μm of dust emission from the simulation WV04 (sil2.0). c) Synthetic observation at 24 μm of dust emission from the simulation HV04 (sil2.0). The black cross shows the position of the ionizing star. The coordinates are in arcseconds relative to the star’s position. The units are in MJy sr-1, shown in logarithmic units (i.e. log 10I). The outer arc/ring is the H ii region boundary and the inner arc may show the edge of the stellar wind bubble. Images are generated from the simulations after 0.4 Myr of evolution in this and the following figures (see Fig. 2).
Current usage metrics show cumulative count of Article Views (full-text article views including HTML views, PDF and ePub downloads, according to the available data) and Abstracts Views on Vision4Press platform.
Data correspond to usage on the plateform after 2015. The current usage metrics is available 48-96 hours after online publication and is updated daily on week days.
Initial download of the metrics may take a while.