Fig. 5
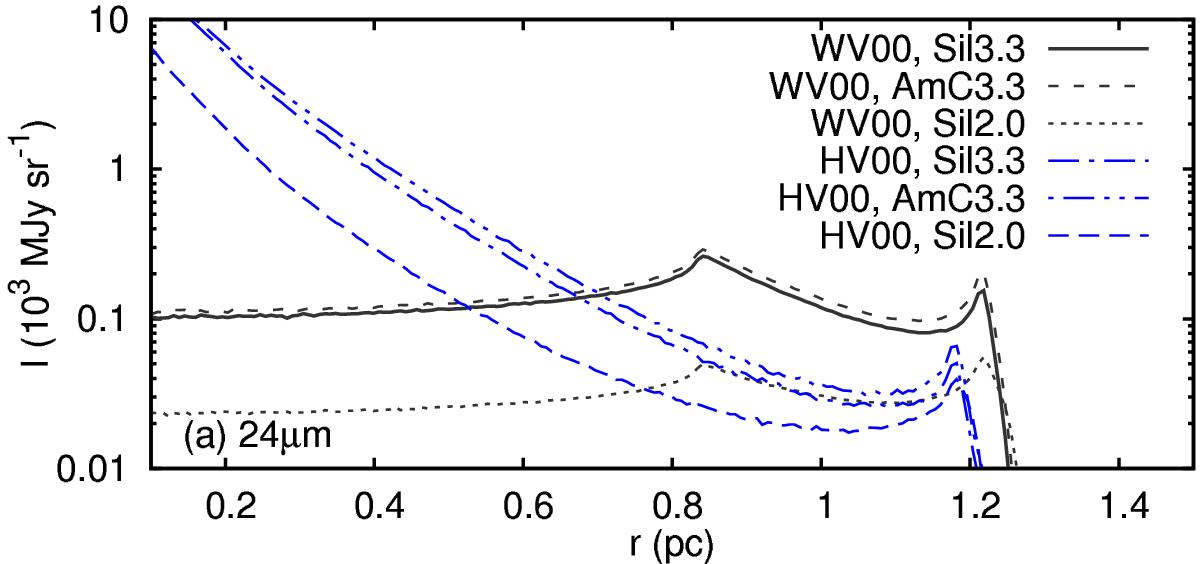
Dust emission (spherically averaged) at 24 μm for the 1D simulations WV00 and HV00 at time 0.2 Myr, using different grain size distributions and dust models. We plot the intensity (or surface brightness, measured in MJy sr-1) as a function of distance, r, from the ionizing star (in parsecs), with a logarithmic y-axis to show the exponential decrease in brightness with radius.
Current usage metrics show cumulative count of Article Views (full-text article views including HTML views, PDF and ePub downloads, according to the available data) and Abstracts Views on Vision4Press platform.
Data correspond to usage on the plateform after 2015. The current usage metrics is available 48-96 hours after online publication and is updated daily on week days.
Initial download of the metrics may take a while.