Fig. 3
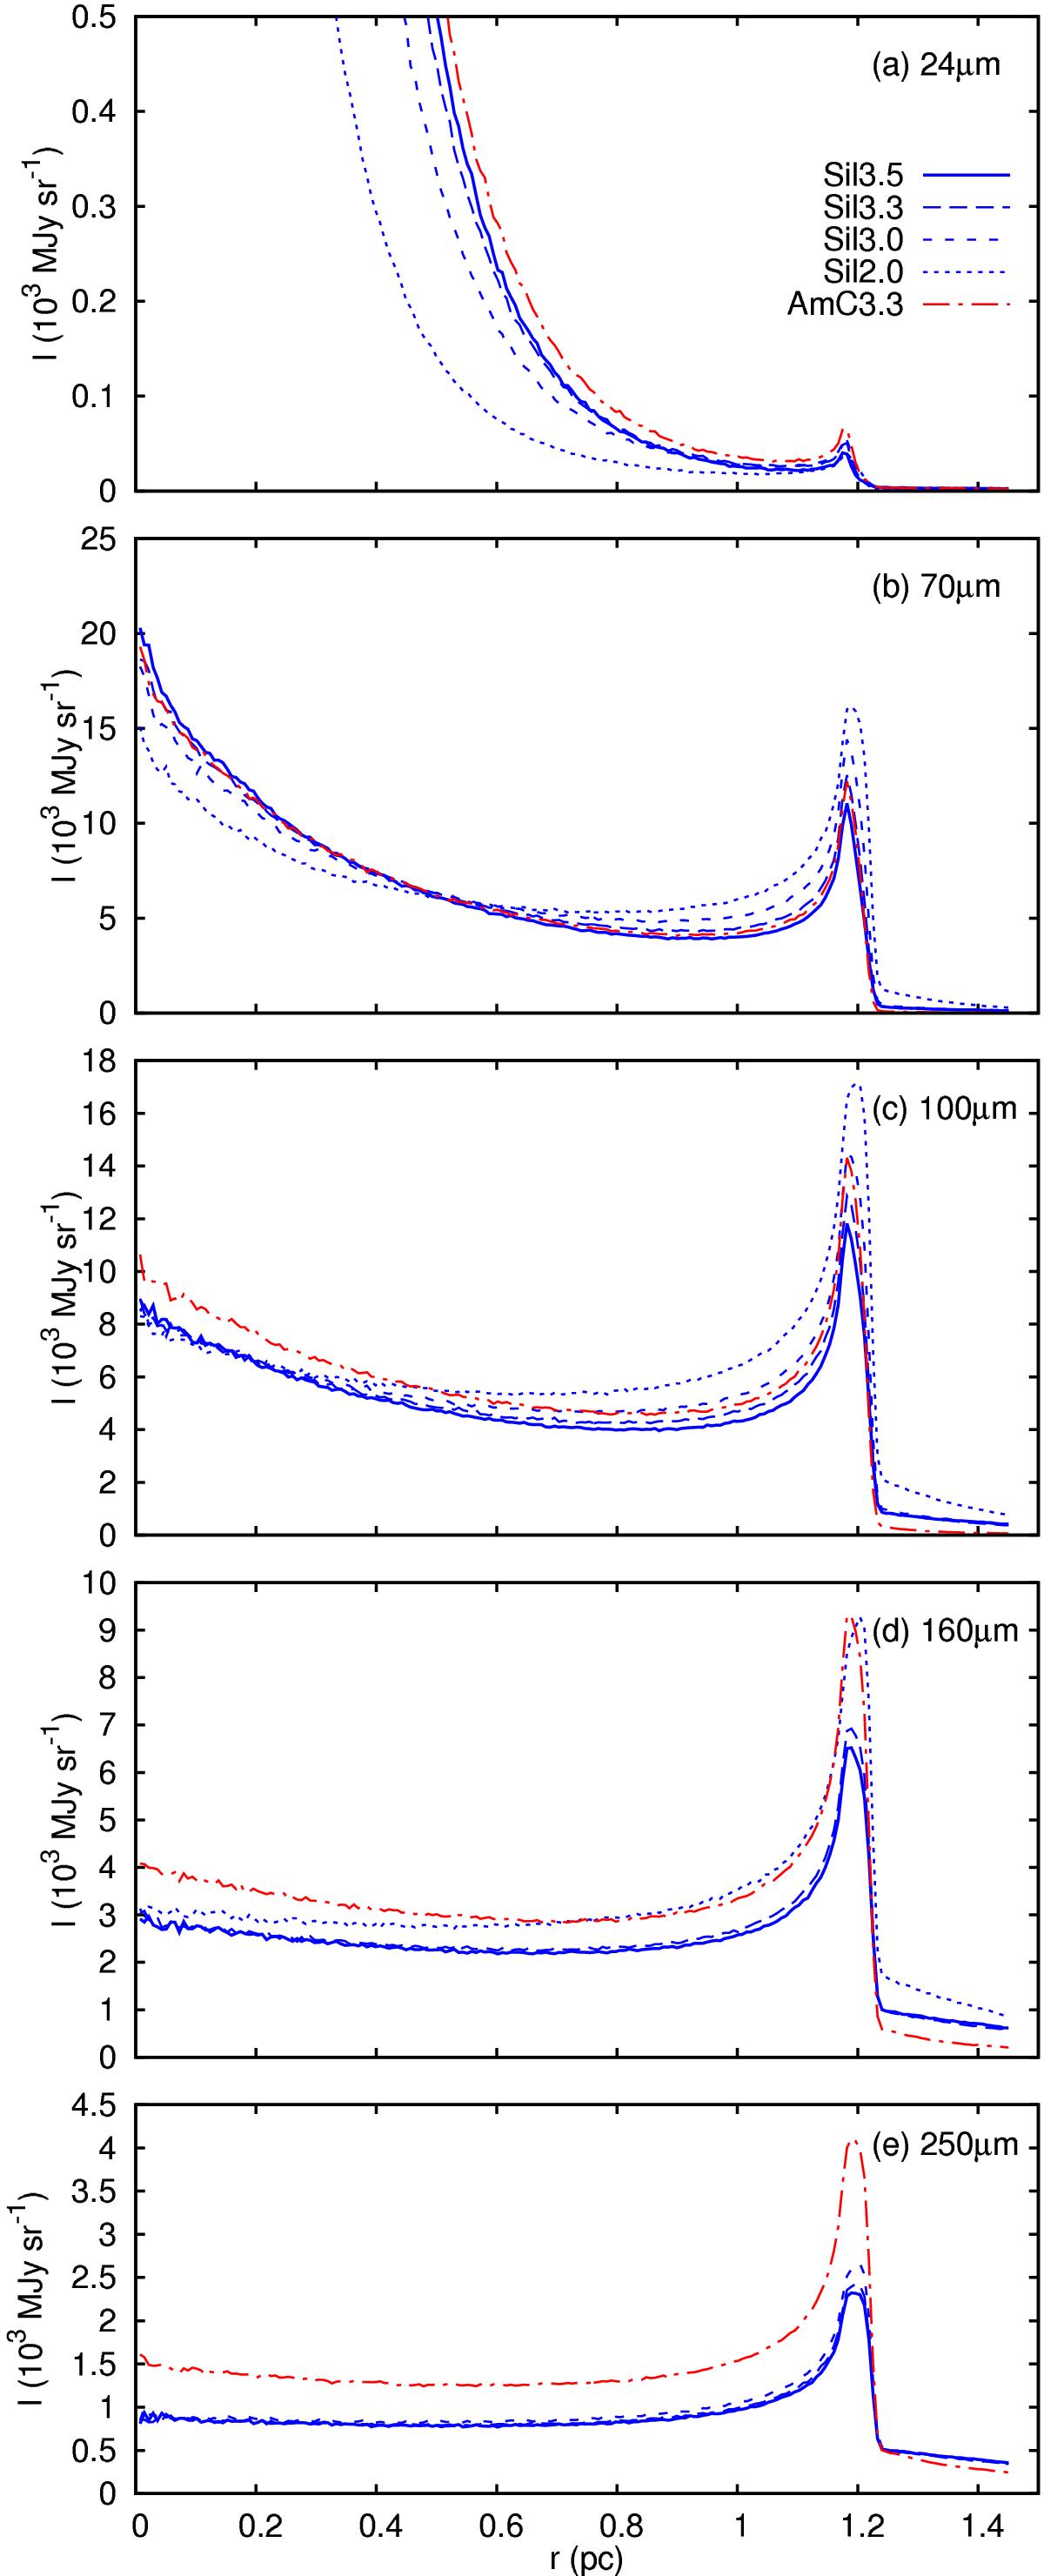
Dust emission (spherically averaged) for the 1D simulation H00 at time 0.2 Myr, using different grain size distributions and dust models. Panels show a) 24 μm emission; b) 70 μm; c) 100 μm; d) 160 μm; and e) 250 μm. “Sil” is for silicate grains, “AmC” is for amorphous carbon grains, and the number is the power law index, q, of the grain size distribution, as listed in Table 2. We plot the intensity (or surface brightness, measured in MJy sr-1) as a function of distance, r, from the ionizing star (in parsecs). There is no wind bubble, so the only peaks are at r = 0 and the H ii region shell at ≈1.2 pc.
Current usage metrics show cumulative count of Article Views (full-text article views including HTML views, PDF and ePub downloads, according to the available data) and Abstracts Views on Vision4Press platform.
Data correspond to usage on the plateform after 2015. The current usage metrics is available 48-96 hours after online publication and is updated daily on week days.
Initial download of the metrics may take a while.