Fig. 2
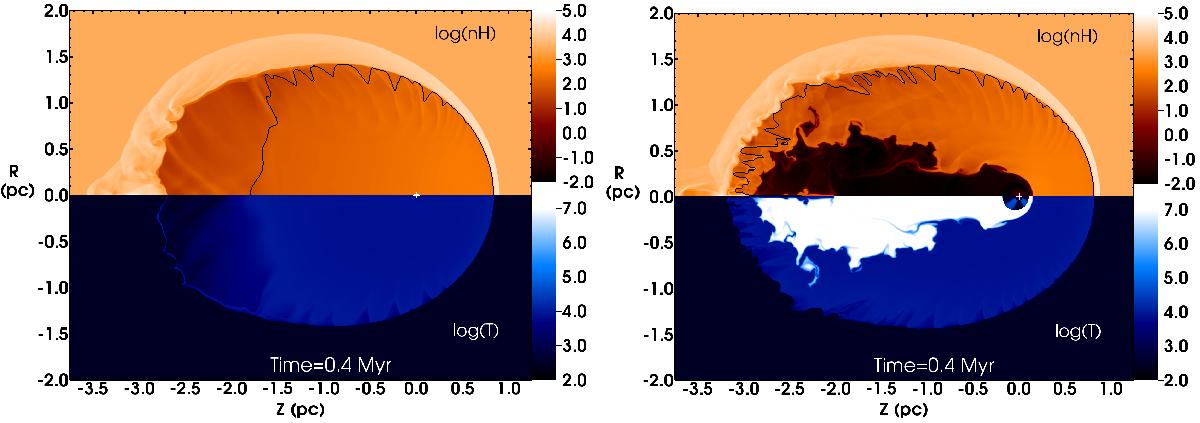
Snapshots of the image plane for simulation HV04 (left) and WV04 (right) showing log of gas number density (upper half-plane) and temperature (lower half-plane). The units are log (nH/ cm-3) and log (T/ K), respectively. A contour showing H ionization fraction, x = 0.5, is also plotted in black in the upper half-plane. The symmetry axis is horizontal, labelled z; the star is at the origin indicated by the white cross, and the ISM is flowing past from right to left at 4 km s-1. Both simulations are plotted at time t = 0.4 Myr.
Current usage metrics show cumulative count of Article Views (full-text article views including HTML views, PDF and ePub downloads, according to the available data) and Abstracts Views on Vision4Press platform.
Data correspond to usage on the plateform after 2015. The current usage metrics is available 48-96 hours after online publication and is updated daily on week days.
Initial download of the metrics may take a while.