Fig. 10
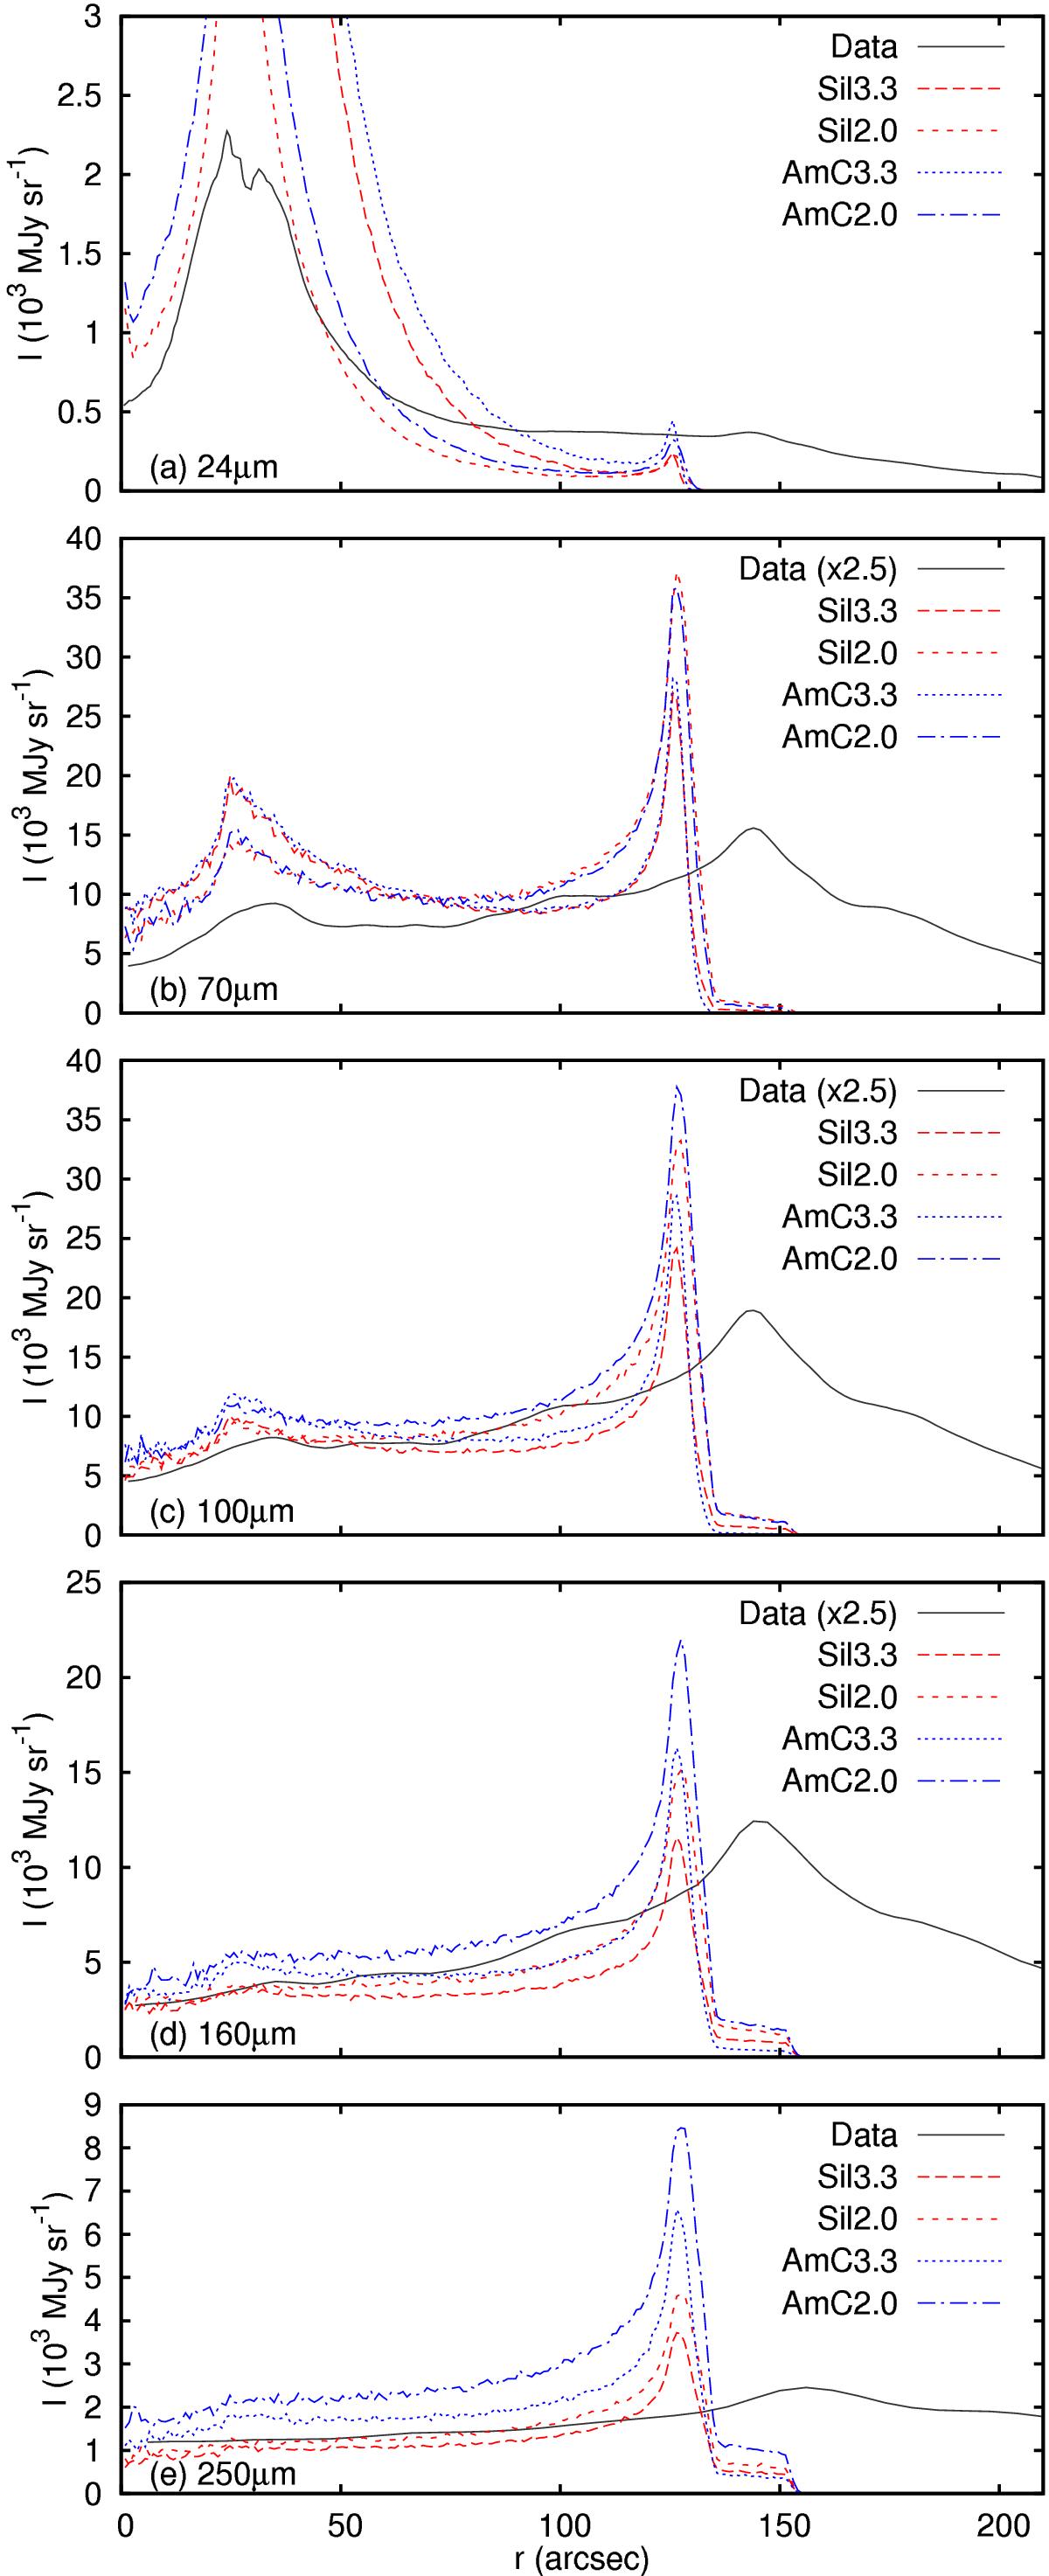
Comparison of dust emission for an angle-averaged 20° wide wedge from the star, showing log of the intensity (in MJy sr-1) as a function of angular distance, r, from the ionizing star (in arcseconds). Panels show a) 24 μm emission; b) 70 μm; c) 100 μm; d) 160 μm; and e) 250 μm. Data for RCW 120 are shown as the solid black line (multiplied by 2.5 in panels b)–d) for clarity), with synthetic emission maps for different grain types and size distributions as the red and blue lines.
Current usage metrics show cumulative count of Article Views (full-text article views including HTML views, PDF and ePub downloads, according to the available data) and Abstracts Views on Vision4Press platform.
Data correspond to usage on the plateform after 2015. The current usage metrics is available 48-96 hours after online publication and is updated daily on week days.
Initial download of the metrics may take a while.