| Issue |
A&A
Volume 586, February 2016
|
|
|---|---|---|
| Article Number | A110 | |
| Number of page(s) | 9 | |
| Section | Interstellar and circumstellar matter | |
| DOI | https://doi.org/10.1051/0004-6361/201527460 | |
| Published online | 02 February 2016 | |
A study of the C3H2 isomers and isotopologues: first interstellar detection of HDCCC⋆
1
Max-Planck-Institut für extraterrestrische Physik,
Giessenbachstr. 1, 85748
Garching, Germany
e-mail: This email address is being protected from spambots. You need JavaScript enabled to view it.
2
California Institute of Technology, 770 S. Wilson Ave., M/C 100-22, Pasadena, CA
91125,
USA
3
I. Physikalisches Institut, Universität zu Köln,
Zülpicher Str. 77, 50937
Köln,
Germany
4
Harvard-Smithsonian Center for Astrophysics, and School of
Engineering & Applied Sciences, Harvard University, Cambridge, MA
02138,
USA
5
Max-Planck Institut für Radioastronomie,
Auf dem Hügel 69, 53121
Bonn,
Germany
Received: 28 September 2015
Accepted: 12 November 2015
Abstract
The partially deuterated linear isomer HDCCC of the ubiquitous cyclic carbene (c-C3H2) was observed in the starless cores TMC-1C and L1544 at 96.9 GHz, and a confirming line was observed in TMC-1 at 19.38 GHz. To aid the identification in these narrow line sources, four centimetre-wave rotational transitions (two in the previously reported Ka = 0 ladder and two new ones in the Ka = 1 ladder) and 23 transitions in the millimetre band between 96 and 272 GHz were measured in high-resolution laboratory spectra. Ten spectroscopic constants in a standard asymmetric top Hamiltonian allow the main transitions of astronomical interest in the Ka ≤ 3 rotational ladders to be calculated to within 0.1 km s-1 in radial velocity up to 400 GHz. Conclusive identification of the two astronomical lines of HDCCC was provided by the VLSR, which is the same as for the normal isotopic species (H2CCC) in the three narrow line sources. In these sources, deuterium fractionation in singly substituted H2CCC (HDCCC/H2CCC ~4−19%) is comparable to that in c-C3H2 (c-C3H2/c-C3HD ~5−17%) and similarly in doubly deuterated c-C3H2 (c-C3D2/c-C3HD ~3−17%), implying that the efficiency of the deuteration processes in the H2CCC and c-C3H2 isomers are comparable in dark clouds.
Key words: astrochemistry / line: identification / ISM: molecules / ISM: clouds
Based on observations carried out with the IRAM 30 m Telescope. IRAM is supported by INSU/CNRS (France), MPG (Germany) and IGN (Spain).
Current address: Division of Astronomical Sciences National Science Foundation, 4201 Wilson Boulevard, Suite 1045, Arlington, VA 22230, USA.
© ESO, 2016
1. Introduction
The study of deuterated molecules in the radio band yields constraints on the physical and chemical properties of the interstellar gas in the early stages of low-mass star formation (Caselli & Ceccarelli 2012). Cyclopropenylidene (c-C3H2) is one of the molecules frequently used in studies of deuterium fractionation in cold dark clouds, because lines of its rare isotopic species are relatively intense, the degree of fractionation is high, and c-C3H2 is believed to form solely by gas phase reactions (Gerin et al. 1987; Bell et al. 1988; Talbi & Herbst 2001; Turner 2001; Liszt et al. 2012; Spezzano et al. 2013). During recent observations of the doubly deuterated species c-C3D2 towards the starless cores TMC-1C and L1544, Spezzano et al. (2013) observed an unidentified line in the millimetre band that was tentatively assigned to the singly deuterated form of propadienylidene (H2CCC)1, a highly polar metastable carbene (μ = 4.17 D) about 14 kcal mol-1 (7045 K) higher in energy than the more stable isomer c-C3H2 (Wu et al. 2010).
Propadienylidene (H2CCC) was detected in space by Cernicharo et al. (1991) and Kawaguchi et al. (1991) shortly after its millimetre-wave rotational spectrum was measured in the laboratory (Vrtilek et al. 1990). Initially, it was observed towards the cold dark cloud TMC-1 in the centimetre and millimetre bands, and the carbon-rich asymptotic giant branch (AGB) star IRC+10216 in the millimetre band. Here, we report the detection of a line of HDCCC in the prestellar cores TMC-1C and L1544 in the millimetre band at 96.9 GHz and a confirming line in TMC-1 in the centimetre band at 19.38 GHz.
Although H2CCC was first observed nearly 25 years ago in the laboratory and the interstellar gas, the deuterated species had not been observed in any astronomical source and the rotational spectrum of the partially deuterated species HDCCC had not been measured in the millimetre band prior to this work, but the two lowest transitions in the centimetre band had been measured earlier (Kim & Yamamoto 2005). In support of the astronomical identification of HDCCC and of future studies of the C3H2 isomeric system in the interstellar gas, the principal millimetre-wave rotational transitions of astronomical interest have now been measured in high resolution laboratory spectra.
2. Laboratory and astronomical observations
2.1. Laboratory
Rotational lines of HDCCC were observed with the same 3 m long free-space double-pass absorption spectrometer used to measure the millimetre-wave spectrum of c-C3D2 (Spezzano et al. 2012). Guided by frequencies calculated with an effective rotational and centrifugal distortion constant derived from the two lowest transitions measured at centimetre wavelengths in a supersonic molecular beam (Kim & Yamamoto 2005), lines of HDCCC were observed in the millimetre band. Following optimization of the normal isotopic species (H2CCC), the most intense lines of HDCCC were observed in a low pressure (~18 mTorr) DC discharge (140 mA) through a statistical mixture of deuterated acetylene (50% HCCD, 25% DCCD, and 25% HCCH), carbon monoxide (CO), and argon (Ar) in a molar ratio of 10:5:1, with the walls of the discharge cell cooled to 150 K. The acetylene sample was produced in real time by dropping an equal mixture of normal (H2O) and heavy water (D2O) on calcium carbide (CaC2). Under these conditions, the signal-to-noise ratio (S/N) of lines of HDCCC near 160 GHz was ≥10 in 15 min of integration. In addition, the two lowest Ka = 0 lines in the centimetre band at 19 and 38 GHz reported earlier by Kim & Yamamoto (2005) were remeasured with the FT microwave spectrometer described in Spezzano et al. (2012), and the two Ka = 1 transitions (21,2−11,1 and 21,1−11,0) were also measured.
In all, 27 rotational lines between 19 and 272 GHz with J ≤ 14 and Ka ≤ 3 (Table 1) are reproduced to an rms uncertainty (28 kHz) that is comparable to the measurement uncertainties with ten spectroscopic constants in Watson’s S reduced Hamiltonian: three rotational constants, five fourth-order distortion constants (DK was constrained to a theoretical value owing to the high correlation with A), and two sixth-order distortion constants (Table 2).
Laboratory frequencies of HDCCC.
Spectroscopic constants of HDCCC (in MHz).
There is no evidence of deuterium hyperfine structure (hfs) when the fundamental transition of HDCCC is observed with high S/N at a resolution of 1 kHz in our molecular beam; therefore, no such structure should be present when this transition is observed in space. With these measurements, lines of HDCCC of principal astronomical interest in rotational ladders with Ka ≤ 3 can now be predicted to an accuracy of about 0.1 km s-1 for transitions up to 400 GHz, allowing for precise measurements of HDCCC in the interstellar gas.
Observed line parameters of H2CCC in TMC-1C and L1544.
Observed line parameters of HDCCC in TMC-1C and L1544.
The evidence that HDCCC is the carrier of the lines observed in our laboratory discharge is overwhelming. The close harmonicity of nine lines in the Ka = 0 rotational ladder with similar relative intensities confirms that there are no misassignments. The derived rotational constants are in excellent agreement with those predicted from a benchmark empirical equilibrium structure of H2CCC (Gauss & Stanton 1999), combined with theoretical vibration-rotation interaction constants in Wu et al. (2010). Specifically, the measured constants B and C are within 0.03% of those estimated from the theoretical structure, and the fourth-order distortion constants are within a factor of two of the corresponding constants in H2CCC and within 20% of those that were calculated here at the B3LYP/cc-pVTZ level of theory and scaled by the ratio of the corresponding experimental (Gottlieb et al. 1993) and theoretical constants of the normal isotopic species H2CCC. Additional evidence for this identification is provided by the relative intensities of lines of HDCCC that are the same to within 30% of those of H2CCC under the same conditions, after taking the statistical mixture of the deuterated acetylene precursor into account.
Predictions based on this work will be available online via the Cologne Database for Molecular Spectroscopy2 (Müller et al. 2005).
2.2. Astronomical
The millimetre-wave observations were done in several observing sessions between September 2012 and April 2014 with the IRAM 30 m telescope at Pico Veleta (Spain). The EMIR receivers in the E090 and E150 configuration were employed, and the observations were made by frequency switching with offsets of ± 3.9 and ± 7.8 MHz in the higher frequency band. All four EMIR sub-bands were connected to the FTS spectrometer, which was set to high resolution mode. The spectrum consisted of four 1.8 GHz wide sub-bands with 50 kHz channel spacing (corresponding to a velocity resolution of 0.15 km s-1 at 3 mm) and a total spectral coverage of 7.2 GHz. The JKaKc = 505−404 transition of H2CCC in TMC-1C was observed with VESPA with a frequency resolution of 20 KHz. Telescope pointing (checked about every two hours) was accurate to 3′′−4′′. The coordinates (see Tables 3 and 4) for TMC-1C3 are from Bell et al. (1988) and Gerin et al. (1987), and those of L1544 coincide with the peak of the 1.3 mm continuum dust emission from Ward-Thompson et al. (1999). The GILDAS4 software (Pety et al. 2005) was used for the data processing.
Observations of the fundamental rotational transition of HDCCC near 19.4 GHz (JKaKc = 101−000) were made in 2007 October during a search for a rotational line of the CCCN− anion5 in TMC-1 (Thaddeus et al. 2008) with the NRAO 100 m Green Bank Telescope (GBT)6. The corresponding transition of H2CCC near 20.8 GHz was also observed during the same session, but only for a fairly short time (~12 min vs. 12 h for HDCCC). The observing procedure was essentially the same as described in Brünken et al. (2007). The observations were done towards the Cyanopolyyne Peak of TMC-1 (see Table 5 for coordinates), and spectra were taken by position switching at a frequency resolution of 1.5 kHz across the 50 MHz band of the GBT spectrometer (other observing conditions were summarized in Thaddeus et al. 2008).
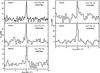 |
Fig. 1 Spectra of H2CCC and HDCCC observed towards TMC-1C with the IRAM 30 m telescope. The integration times for H2CCC were 3 h at 82 and 83 GHz, 4 h at 102 GHz, and 23 h at 103 GHz. For HDCCC the integration time was 16 h. |
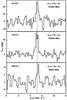 |
Fig. 2 Spectra of H2CCC and HDCCC observed towards L1544 with the IRAM 30 m telescope. The integration times were 4 h for H2CCC and 9.6 h for HDCCC. |
2.2.1. HDCCC
The 50,5−40,4 transition of HDCCC at 96.9 GHz was observed in TMC-1C and L1544 (Figs. 1 and 2). Because the VLSR is in excellent agreement with that of other molecules in these two narrow line sources, these spectra provide strong evidence that HDCCC has been observed for the first time in the interstellar gas. The probability of a misidentification due to a line of another carrier coinciding to within twice the typical line width of about 200 kHz is very small (~2 × 10⁻³), owing to the very low density of lines in these two sources of about 20 lines in each 1.8 GHz wide sub-band. Additional evidence for an astronomical identification of HDCCC was sought by means of other transitions in the millimetre band; however, the rotational spectrum of HDCCC is not rich in lines. On the assumption that only levels in the Ka = 0 ladder are appreciably populated in these cold dense cores (those with Ka ≠ 0 are not metastable and are higher in energy by ≥12 K), there are three transitions that are readily accessible with current ground-based telescopes and that might be detectable with deep integrations: the two lowest ones at 19 and 38 GHz and one at 136 GHz.
Our initial attempt to detect a second line of HDCCC in the millimetre band was inconclusive. Although the transition at 135.6 GHz was not detected in TMC-1C with the IRAM 30 m telescope, our upper limit of the main beam temperature at this frequency (≤3 mK) is higher than predicted from the column density derived from the line at 96.9 GHz on the assumption that the excitation temperature is 4 K (see Sect. 3). We then realized that the 10,1−00,0 transition at 19 GHz was covered in 2007 October in a deep search for the CCCN− anion in TMC-1 with the GBT (Thaddeus et al. 2008). Shown in Fig. 3 are the spectra with the fundamental transition of HDCCC and H2CCC in TMC-1 at the precise VLSR of 5.8 ± 0.1 km s-1 in this much studied position in the Taurus molecular cloud, confirming our initial assignment of the line at 96.9 GHz to the 50,5−40,4 transition of HDCCC. As in the laboratory spectrum (Sect. 2.1), there is no evidence of deuterium hyperfine structure in the line in TMC-1 at 19 GHz.
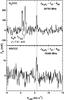 |
Fig. 3 Fundamental transitions of HDCCC and H2CCC in TMC-1. Also present in the upper panel is the hyperfine-split transition of C6H in the lower Λ component (e) at 20792.872 and 20792.945 MHz. Partially resolved kinematic structure is seen in the lines of HDCCC and C6H, but not in H2CCC owing to the lower S/N. The dashed line at + 5.8 km s-1 indicates the systemic velocity of TMC-1. The integration time was approximately 11.5 h for the HDCCC and 12 min for the H2CCC spectrum. Both spectra were Hanning-smoothed to a frequency resolution of 6.1 kHz. A similar spectrum was observed by Cernicharo et al. (1987), see Fig. 2 lower left panel in their paper, and Fossé et al. (2001), see Fig. 1 upper panel. In the paper by Cernicharo et al. (1987), the line of H2CCC was reported as an unidentified feature because the laboratory spectrum of H2CCC was not known yet. |
Centimetre-wave lines of HDCCC and H2CCC in TMC-1.
2.2.2. H2CCC
Simultaneous with the observations of HDCCC (Sect. 2.2.1), a para (50,5−40,4) and an ortho (51,5−41,4) transition of the main isotopic species H2CCC were observed in TMC-1C and L1544 in 2012 September; and two additional transitions (40,4−30,3 and 41,4−31,3) were observed in TMC-1C in 2014. The line parameters and derived column densities are reported in Table 3, and the spectra are shown in Figs. 1 and 2.
Owing to the two equivalent off-axis hydrogen atoms, H2CCC has ortho and para symmetry states with a relative statistical weight (ortho/para) of 3:1, where rotational levels with odd Ka have ortho symmetry and those with even Ka have para symmetry. Monodeuterated HDCCC does not have ortho/para symmetry. It has been shown that the ortho/para ratio might depart from the statistical value, especially at the low temperatures that characterize cold dark cores, such as TMC-1C and L1544 (T = 4−10 K, Park et al. 2006). While analysing our data, we do not constrain the value of the ortho/para ratio, except in the case of TMC-1 where just one (para) line has been observed. In this case the ortho/para ratio was constrained to the statistical value (see Sect. 3).
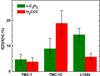 |
Fig. 4 D/H isotopic ratio in the carbene isomers H2CCC and c-C3H2 in three dense cores in the Taurus molecular cloud: TMC-1, TMC-1C, and L1544. For c-C3H2, the heights of the bars indicate the average value, and the error bars the range of values inferred in previous studies of TMC-1 (Turner 2001) and of TMC-1C and L1544 (Spezzano et al. 2013). |
3. Analysis
The column densities in Tables 3−5 were
calculated with the following expression for optically thin transitions in rotational
equilibrium at a temperature Tex (Goldsmith & Langer 1999):
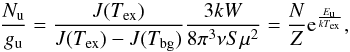 (1)where Nu,
gu, and Eu are the column
density, degeneracy, and energy of the upper state of the transition; W is the integrated
intensity; ν
the frequency; S the rotational line strength; μ the dipole moment;
Z the
rotational partition function; and
(1)where Nu,
gu, and Eu are the column
density, degeneracy, and energy of the upper state of the transition; W is the integrated
intensity; ν
the frequency; S the rotational line strength; μ the dipole moment;
Z the
rotational partition function; and  . The factor J(Tex) / [
J(Tex)−J(Tbg)
] accounts for the line absorption of the cosmic background radiation
(Tbg =
2.7 K), and is significantly larger than unity at the low excitation
temperatures (Tex<
10 K) inferred for H2CCC and other polar molecules in cold dark clouds. The
column densities were calculated assuming an excitation temperature of 4 K, by analogy with
earlier work from Cernicharo et al. (1991) and Kawaguchi et al. (1991). On this assumption, from the
column densities derived from the para and ortho lines of H2CCC in TMC-1C and L1544, we infer
ortho/para ratio of ~3,
which is consistent with the canonical ratio of 3. There are three principal sources of
uncertainty in our derived column densities of H2CCC and HDCCC: the excitation temperature, the ortho/para
ratio in H2CCC, and
possible systematic uncertainties in the integrated areas of the observed line profiles. The
results here allow us to derive the D/H ratio in H2CCC in three sources for the first time. On the assumption
that Tex is 4 K in both H2CCC and HDCCC, the D/H ratio in
H2CCC is
19 ± 5% in TMC-1C and
6 ± 1.3% in L1544 (Fig. 4). However, more observations are needed to better
constrain the excitation temperature in both isotopic species and, in turn, the D/H ratio.
Similarly, the centimetre-wave observation of the fundamental transition of HDCCC and para
H2CCC allowed us to
estimate an approximate D/H ratio in TMC-1. We find that the extent of the deuteration in
TMC-1 (4 ± 1.6%) is comparable
to L1544, but is two-to-five times less than in TMC-1C.
. The factor J(Tex) / [
J(Tex)−J(Tbg)
] accounts for the line absorption of the cosmic background radiation
(Tbg =
2.7 K), and is significantly larger than unity at the low excitation
temperatures (Tex<
10 K) inferred for H2CCC and other polar molecules in cold dark clouds. The
column densities were calculated assuming an excitation temperature of 4 K, by analogy with
earlier work from Cernicharo et al. (1991) and Kawaguchi et al. (1991). On this assumption, from the
column densities derived from the para and ortho lines of H2CCC in TMC-1C and L1544, we infer
ortho/para ratio of ~3,
which is consistent with the canonical ratio of 3. There are three principal sources of
uncertainty in our derived column densities of H2CCC and HDCCC: the excitation temperature, the ortho/para
ratio in H2CCC, and
possible systematic uncertainties in the integrated areas of the observed line profiles. The
results here allow us to derive the D/H ratio in H2CCC in three sources for the first time. On the assumption
that Tex is 4 K in both H2CCC and HDCCC, the D/H ratio in
H2CCC is
19 ± 5% in TMC-1C and
6 ± 1.3% in L1544 (Fig. 4). However, more observations are needed to better
constrain the excitation temperature in both isotopic species and, in turn, the D/H ratio.
Similarly, the centimetre-wave observation of the fundamental transition of HDCCC and para
H2CCC allowed us to
estimate an approximate D/H ratio in TMC-1. We find that the extent of the deuteration in
TMC-1 (4 ± 1.6%) is comparable
to L1544, but is two-to-five times less than in TMC-1C.
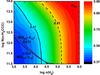 |
Fig. 5 Integrated area (W) for the 41,4−31,3 transition (blue contour) and 51,5−41,4 transition (red contour) of H2CCC, and the ratio of the integrated areas R54 (solid black contour) versus the total column density of ortho H2CCC and the H2 density. |
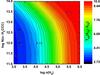 |
Fig. 6 Dependence of the excitation temperature (Tex) of the 41,4−31,3 and 51,5−41,4 transitions of ortho H2CCC on the column density and the H2 density, on the assumption that the kinetic temperature is 10 K. The colour scale applies to the 41,4−31,3 transition and the dashed contours to the 51,5−41,4 transition. |
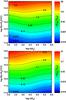 |
Fig. 7 Dependence of the optical depths (τ) of the 41,4−31,3 and 51,5−41,4 transitions of ortho H2CCC on the column density and the H2 density. |
3.1. Excitation and abundance of H2CCC and HDCCC
To determine whether LTE is a good approximation for estimating the rotational excitation temperature (Tex) and column density (N) of H2CCC and HDCCC (Sect. 3), Tex and N were compared with the corresponding properties of H2CCC obtained from statistical equilibrium calculations with RADEX (van der Tak et al. 2007). The calculations were done for a uniform spherical geometry for TMC-1C, a line width of 0.3 km s-1 (FWHM), a kinetic temperature of 10 K, and a radiation temperature of 2.73 K. Following Cernicharo et al. (1999), we used collisional de-excitation rates that are two times higher than those for ortho-H2CO with para H2 as provided in the LAMDA database (Schöier et al. 2005; Wiesenfeld & Faure 2013). Only the lowest 18 rotational levels in the Ka = 1 ladder of H2CCC were included, because the cross-ladder collisional rates (ΔK = 2) are nearly an order of magnitude lower. Similarly, collisions with ortho-H2 were neglected because the ortho/para ratio for H2 is negligible at 10 K (cf., Troscompt et al. 2009).
Summarized in Figs. 5−7 are the results of the statistical equilibrium calculations. It is evident that the integrated areas (W) of the two ortho transitions of H2CCC and the ratio of the two imply that log n(H2) ~ 4.25 and log N ~ 11.25 (i.e., n(H2) = 2 × 104 cm-3 and N = 2 × 1011 cm-2; Fig. 5). Under the same conditions we estimate that Tex ~ 4 K (Fig. 6), and H2CCC is optically thin in both transitions (i.e., τ ≤ 0.05 in 41,4−31,3 and 51,5−41,4; Fig. 7). As a result, we find that the rotational temperature derived for H2CCC in TMC-1 by Cernicharo et al. (1991) and Kawaguchi et al. (1991) is valid for TMC-1C, hence also a valid assumption for L1544. We also find that the column density derived for ortho H2CCC on the assumption of LTE is essentially the same as derived with RADEX (see Table 6).
4. Discussion
The present work is a preliminary study of different isomers and isotopologues of the C3H2 system. Isomers and isotopologues are precious tools for astrochemists because they convey useful information for disentangling different chemical routes that might correspond to different physical conditions. In particular, the astrophysically relevant properties of the C3H2 system studied in this paper are the D/H abundance ratio in each isomer and the cyclic-to-linear abundance ratio.
The cyclic-to-linear isomeric ratio of C3H2 appears to depend on the region where the isomers are observed, meaning that the c-C3H2/H2CCC ratio increases with decreasing electron abundance (Fossé et al. 2001). A summary of the c-C3H2/H2CCC ratio in different environments is reported in Table 7. In dense molecular clouds, the ratio is between 20 and 40 (Kawaguchi et al. 1991; Cernicharo et al. 1991; Fossé et al. 2001), while in diffuse clouds it is lower by one order of magnitude (Cernicharo et al. 1999). In the Horsehead nebula PDR, the c-C3H2/H2CCC ratio has a value of three to five in the diffuse gas, and it increases by a factor of 4 when penetrating in the denser region of the cloud (Teyssier et al. 2005). Towards the Orion Bar a c-C3H2/H2CCC ratio of 34 has been observed very recently (Cuadrado et al. 2015). Perhaps alternative formation/destruction routes occur towards the Orion Bar, which is a very extreme environment (>300 times the far-UV radiation flux with respect to the Horsehead nebula), which might allow endothermic reactions and reactions with a high energy barrier to become efficient. The c-C3H2/H2CCC ratio in TMC-1C is about two times higher than in TMC-1, along the filament in TMC-1 (see Fig. 3 in Fossé et al. (2001), and in L1544. The causes for this behaviour might be a systematic error in the H2CCC column density (see Sect. 3), the overall difficulty in deriving accurate column densities of c-C3H2, or different physical conditions in TMC-1C with respect to TMC-1 and L1544.
Column density and excitation temperature of ortho H2CCC in TMC-1C.
Isomeric and D/H ratios of H2CCC and c-C3H2 in six Galactic regions.
The variation in the cyclic-to-linear ratio in different environments is related to
distinct destruction and possibly formation pathways for the two isomers. These pathways
still need to be fully understood. Talbi et al.
(2009) present the results of calculations on the dissociative recombination of
cyclic and linear C3H with electrons. It is shown that the
formation of c-C3H2 from c-C3H is more efficient than the formation of
H2CCC from
l-C3H. A similar result was obtained by Adams & Babcock (2005), who in fact observed in an
afterglow experiment that the cyclic C3H recombines with electrons faster than the
linear isomer. Interestingly, Chabot et al. (2013)
show that with their new semiempirical model for calculating branching ratios while
c-C3H is the main product of the dissociative recombination of
c-C3H
with electrons. It is shown that the
formation of c-C3H2 from c-C3H is more efficient than the formation of
H2CCC from
l-C3H. A similar result was obtained by Adams & Babcock (2005), who in fact observed in an
afterglow experiment that the cyclic C3H recombines with electrons faster than the
linear isomer. Interestingly, Chabot et al. (2013)
show that with their new semiempirical model for calculating branching ratios while
c-C3H is the main product of the dissociative recombination of
c-C3H with electrons, l-C3H is not the main product of the
recombination of l-C3H with electrons. Unfortunately, the branching
ratios of the dissociative recombination of linear and cyclic C3H are not provided in Chabot et al. (2013).
with electrons, l-C3H is not the main product of the
recombination of l-C3H with electrons. Unfortunately, the branching
ratios of the dissociative recombination of linear and cyclic C3H are not provided in Chabot et al. (2013).
The formation of c-C3HD and c-C3D2 in dense cores has been studied for a long time (Gerin et al. 1987; Bell et
al. 1988; Spezzano et al. 2013), and it is
believed to occur through subsequent deuteration of c-C3H2 via reactions with
H2D+, D2H+, and D3+ followed by the dissociative
recombination of the ionic intermediate with electrons (see Fig. 3 in Spezzano et al. 2013). The intermediates of this reaction scheme are
C3H, C3H2D+, C3HD, and C3D. When shown schematically, singly deuterated
carbenes are produced by the formal reactions  where RH2≡c-C3H2 (or H2CCC), and the doubly deuterated carbenes by the reactions
 For simplicity only the reactions with
H2D+ are shown, but the same set of
reactions will proceed with D2H+ and D. Table 7 and Fig. 4 report the D/H abundance
ratios in both the cyclic and linear isomers of C3H2 in TMC-1C, L1544, and TMC-1. The D/H abundance ratio in
both the cyclic and linear form of C3H2 are similar in all our observations, suggesting that the
deuteration of the linear isomer might follow the same reaction scheme as the cyclic, with
the difference that the deuteration of the linear isomer will not proceed as
straightforwardly as the cyclic. In contrast to the cyclic, the linear deuterated
intermediate ion (H2CCCD+) will have to undergo atom exchange or structural
rearrangement while recombining with electrons, otherwise it will react back to
H2CCC. More
experimental and theoretical studies are required to understand the detailed mechanism of
deuteration of H2CCC.
TMC-1C shows an enhanced deuteration in the linear isomer compared to the cyclic. Given the
difficulty in deriving accurate column densities for c-C3H2, and the possibility of having a
systematic error in the column density derived for H2CCC in TMC-1C, the authors do not
feel the necessity to put too much emphasis on this result.
For simplicity only the reactions with
H2D+ are shown, but the same set of
reactions will proceed with D2H+ and D. Table 7 and Fig. 4 report the D/H abundance
ratios in both the cyclic and linear isomers of C3H2 in TMC-1C, L1544, and TMC-1. The D/H abundance ratio in
both the cyclic and linear form of C3H2 are similar in all our observations, suggesting that the
deuteration of the linear isomer might follow the same reaction scheme as the cyclic, with
the difference that the deuteration of the linear isomer will not proceed as
straightforwardly as the cyclic. In contrast to the cyclic, the linear deuterated
intermediate ion (H2CCCD+) will have to undergo atom exchange or structural
rearrangement while recombining with electrons, otherwise it will react back to
H2CCC. More
experimental and theoretical studies are required to understand the detailed mechanism of
deuteration of H2CCC.
TMC-1C shows an enhanced deuteration in the linear isomer compared to the cyclic. Given the
difficulty in deriving accurate column densities for c-C3H2, and the possibility of having a
systematic error in the column density derived for H2CCC in TMC-1C, the authors do not
feel the necessity to put too much emphasis on this result.
In dense prestellar and protostellar dark cloud cores, the c-C3HD/c-C3H2 and c-C3D2/c-C3HD ratios are very similar to those in dark clouds (Table 7), in spite of the different mechanisms thought to govern the abundances of unsaturated carbon chains and carbenes in these regions. In addition to the ion-molecule processes that produce carbon chains and carbenes in prestellar cores and cold dark clouds, sublimation of methane from grain mantles warmed up by the faint protostar is hypothesized to yield elevated abundances of carbon chains and carbenes in low-mass protostellar cores (see Cordiner et al. 2012, for a summary of the proposed mechanisms). Similar D/H ratios in prestellar and protostellar cores indicate that once the non-deuterated carbene is formed, the singly and doubly deuterated carbene are produced by reactions (2) to (5), notwithstanding the formation mechanism.
A plausible explanation for the similar D/H ratios of c-C3H2 in the two types of dark cloud cores is as follows. Owing to freeze-out in the inner regions of prestellar cores – by analogy with the well-known case of HCO+ and DCO+, which are heavily depleted in the cold inner regions of prestellar cores – carbenes reside primarily in the warmer outer regions (Caselli 2002). As a result, if the abundance of H2D+ and the electron fraction in the outer regions of prestellar cores are similar to those in protostellar cores7, according to reactions (2) to (5), similar c-C3HD/c-C3H2 and c-C3D2/c-C3HD ratios are expected. There are no observations of HDCCC in protostellar cores, but the next larger cumulene carbene HDCCCC has been detected in L1527 at ~3−4% that of H2CCCC (Sakai et al. 2009b). Therefore, it would not be surprising if the HDCCC/H2CCC ratio in L1527 and other protostellar cores is similar to ratios in dense prestellar cores and dark clouds.
To gain a more conclusive understanding of the chemistry of the C3H2 system, the
HDCCC/H2CCC and the
c-C3HD/c-C3D2 ratios should be systematically studied in a larger sample
of dense cores. For example, Emprechtinger et al.
(2009) have investigated the use of the N2D+/N2H+ ratio as an evolutionary tracer of Class 0 protostars. A
comparison with the results obtained by Emprechtinger et al.
(2009) would clarify whether the C3H2 system fails to be an evolutionary tracer, because carbenes
are heavily depleted in the inner core of the cloud. Future observations with
interferometers, NOEMA, and ALMA will shine some light on how the deuteration of different
tracers changes with radial distance from the prestellar and protostellar core. More precise
inferences derived from the observed D/H ratios in c-C3H2 and H2CCC will also require further
laboratory kinetic measurements. The reaction rates of the proton and deuteron transfer from
H (and deuterated isotopologues) to
RH2 (and deuterated
isotopologues) have not been studied yet. Also the collisional rates for H2CCC with H2 are not yet available. The
recombination of the linear and cyclic C3H with electrons has been studied by McLain et al. (2005) and Adams & Babcock (2005), but it cannot be confirmed that the skeleton of the
ion is kept during the reaction. The deuteration of the C3H2 isomers will be better understood
if the ionic intermediates, C3H, C3H2D+, C3HD, and C3D, were observed in dark clouds. Although
laboratory-measured rotational spectra of these species are unavailable at present, high
level quantum calculations for the C3H system are available to guide laboratory
searches (Huang & Lee 2011). With precise
laboratory rest frequencies in hand, deep radio astronomical searches for these ions could
be undertaken, and the observed column densities (or upper limits) would allow refinements
to chemical models of dark clouds.
Now that the rotational spectrum of HDCCC has been measured in the millimetre band and the molecule has been detected in three sources, a comprehensive kinetic model is needed to aid interpretation of the existing astronomical observations and to guide future observations of the C3H2 system. H2CCC and c-C3H2 are currently considered separately in the KIDA chemical reaction database (Wakelam et al. 2015). However, to our knowledge, no complete model that distinguishes between the possibly different deuteration pathways for these two species currently exists. With the above caveats on missing laboratory data, we are working on a chemical model that includes the deuterated forms and spin states of these species, following the methods laid out in Sipilä et al. (2015). Observationally, several additional transitions should be measured in HDCCC, preferably in the centimetre band, thereby allowing a more accurate determination of the D/H ratio in H2CCC. The 20,2−10,1 transition at 38.77 GHz should be six times more intense, and the two Ka = 1 transitions at 38.28 and 39.25 GHz should be comparable to the line at 19.38 GHz. Unfortunately, it might not be feasible to observe the singly deuterated HDCCC in the less dense regions listed in Table 7, because the lines of H2CCC are not very intense there. However, there are a number of cold dark clouds, prestellar cores, and protostellar cores in which HDCCC might be detectable, if the D/H ratio and the c-C3H2/H2CCC isomeric ratio are comparable to those in TMC-1, TMC-1C, and L1544. These include L1527, Lupus-1, Lupus1-A, L483, ChaMMS1, and others where H2CCC has been detected (Sakai et al. 2009b,a; Cordiner et al. 2012). Extending the determination of the D/H ratio in both isomers might serve as an independent test of models of dark cloud chemistry.
Propadienylidene (Chemical Abstracts Services CAS #: 60731-10-4) is usually designated in the spectroscopic and astronomical literature as H2CCC (e.g., Vrtilek et al. 1990; Cernicharo et al. 1991) to distinguish it from its cyclic isomer c-C3H2, and because it has a same structure and symmetry as the well known molecules formaldehyde (H2CO) and ketene (H2CCO). Although propadienylidene is occasionally designated as l-C3H2, here we follow the example of spectroscopists and astronomers and refer to propadienylidene as H2CCC.
The source referred to here as TMC-1C, following the nomenclature from Bell et al. (1988), is listed as JCMTSF J044115.2+254932 in the SIMBAD database (http://cds.u-strasbg.fr).
The J = 2−1 transition of CCCN− is 22 MHz higher in frequency than the fundamental transition of HDCCC.
The National Radio Astronomy Observatory is a facility of the National Science Foundation operated under cooperative agreement by Associated Universities, Inc.
This is indeed the case for low-mass cores in the Taurus complex, where Caselli et al. (2008) report similar column densities of ortho-H2D+ toward 5 prestellar and 2 protostellar cores: N(o - H2D+) ~ 1−5 × 1013 cm-2. The electron fractions in the outer regions of typical low-mass cores as inferred from the DCO+/HCO+ and HCO+/CO ratios are similar: ~10-8−10-6 (Caselli 2002, and references therein).
Acknowledgments
This work is carried out within the Collaborative Research Centre 956, sub-project [B2], funded by the Deutsche Forschungsgemeinschaft (DFG), and has also been supported by the NASA grant NNX13AE59G. S. Spezzano wishes to thank the Bonn Cologne Graduate School of Physics and Astronomy (BCGS) for financial support. Any opinions, findings, and conclusions in this article are those of the authors and do not necessarily reflect the views of the National Science Foundation.
References
- Adams, N. G., & Babcock, L. M. 2005, J. Phys. Conf. Ser., 4, 38 [NASA ADS] [CrossRef] [Google Scholar]
- Bell, M. B., Avery, L. W., Matthews, H. E., et al. 1988, ApJ, 326, 924 [NASA ADS] [CrossRef] [Google Scholar]
- Brünken, S., Gupta, H., Gottlieb, C. A., McCarthy, M. C., & Thaddeus, P. 2007, ApJ, 664, L43 [NASA ADS] [CrossRef] [Google Scholar]
- Cernicharo, J., Guélin, M., Menten, K. M., & Walmsley, C. M. 1987, A&A, 181, L1 [NASA ADS] [Google Scholar]
- Cernicharo, J., Gottlieb, C. A., Guélin, M., et al. 1991, ApJ, 368, L39 [NASA ADS] [CrossRef] [Google Scholar]
- Cernicharo, J., Cox, P., Fossé, D., & Güsten, R. 1999, A&A, 351, 341 [NASA ADS] [Google Scholar]
- Caselli, P. 2002, Planet. Space Sci., 50, 1133 [NASA ADS] [CrossRef] [Google Scholar]
- Caselli, P., & Ceccarelli, C. 2012, A&ARv, 20, 56 [NASA ADS] [CrossRef] [MathSciNet] [Google Scholar]
- Caselli, P., Vastel, C., Ceccarelli, C., van der Tak, F. F. S., & Bacmann, A. 2008, A&A, 492, 703 [NASA ADS] [CrossRef] [EDP Sciences] [Google Scholar]
- Chabot, M., Béroff, K., Gratier, P., Jallat, A., & Wakelam, V. 2013, ApJ, 771, 90 [NASA ADS] [CrossRef] [Google Scholar]
- Cordiner, M., Charnley, S. B., Wirström, E. S., & Smith, R. G. 2012, ApJ, 744, 131 [NASA ADS] [CrossRef] [Google Scholar]
- Cuadrado, S., Goicoechea, J. R., Pilleri, P., et al. 2015, A&A, 575, A82 [NASA ADS] [CrossRef] [EDP Sciences] [Google Scholar]
- Emprechtinger, M., Caselli, P., Volgenau, N. H., Stutzki, J., & Wiedner, M. C. 2009, A&A, 493, 89 [NASA ADS] [CrossRef] [EDP Sciences] [Google Scholar]
- Fossé, D., Cernicharo, J., Gerin, M., & Cox, P. 2001, ApJ, 552, 168 [NASA ADS] [CrossRef] [Google Scholar]
- Gauss, J., & Stanton, J. F. 1999, J. Mol. Str., 485, 93 [Google Scholar]
- Gerin, M., Wootten, H. A., Combes, F., et al. 1987, A&A, 173, L1 [NASA ADS] [Google Scholar]
- Goldsmith, P. F., & Langer, W. D. 1999, ApJ, 517, 209 [NASA ADS] [CrossRef] [Google Scholar]
- Gottlieb, C. A., Killian, T. C., Thaddeus, P., et al. 1993, J. Chem. Phys., 98, 4478 [NASA ADS] [CrossRef] [Google Scholar]
- Huang, X., & Lee, T. J. 2011, ApJ, 736, 33 [NASA ADS] [CrossRef] [Google Scholar]
- Kawaguchi, K., Kaifu, N., Ohishi, M., et al. 1991, PASJ, 43, 607 [NASA ADS] [Google Scholar]
- Kim, E., & Yamamoto, S. 2005, J. Mol. Spectr., 233, 93 [Google Scholar]
- Liszt, H., Sonnentrucker, P., Cordiner, M., & Gerin, M. 2012, ApJ, 753, L2 [NASA ADS] [CrossRef] [Google Scholar]
- McLain, J. L., Poterya, V., Molek, C. D., et al. 2005, J. Phys. Chem. A, 109, 5119 [CrossRef] [Google Scholar]
- Müller, H. S. P., Schlöder, F., Stutzki, J., & Winnewisser, G. 2005, J. Mol. Struct., 742, 215 [NASA ADS] [CrossRef] [Google Scholar]
- Park, I. H., Wakelam, V., & Herbst, E. 2006, A&A, 449, 631 [NASA ADS] [CrossRef] [EDP Sciences] [Google Scholar]
- Pety, J., Teyssier, D., Fossé, D., et al. 2005, A&A, 435, 885 [NASA ADS] [CrossRef] [EDP Sciences] [Google Scholar]
- Pety, J., Gratier, P., Guzmán, V., et al. 2012, A&A, 548, A68 [NASA ADS] [CrossRef] [EDP Sciences] [Google Scholar]
- Sakai, N., & Yamamoto, S. 2013, Chem. Rev., 113, 8981 [CrossRef] [Google Scholar]
- Sakai, N., Sakai, T., Hirota, T., Burton, M., & Yamamoto, S. 2009a, ApJ, 697, 769 [NASA ADS] [CrossRef] [Google Scholar]
- Sakai, N., Sakai, T., Hirota, T., & Yamamoto, S. 2009b, ApJ, 702, 1025 [NASA ADS] [CrossRef] [Google Scholar]
- Schöier, F. L., van der Tak, F. F. S., van Dishoeck, E. F., & Black, J. H. 2005, A&A, 432, 639 [Google Scholar]
- Sipilä, O., Caselli, P., & Harju, J. 2015, A&A, 578, A55 [NASA ADS] [CrossRef] [EDP Sciences] [Google Scholar]
- Spezzano, S., Tamassia, F., Thorwirth, S., et al. 2012, ApJS, 200, 1 [NASA ADS] [CrossRef] [Google Scholar]
- Spezzano, S., Brünken, S., et al. 2013, ApJ, 769, L19 [NASA ADS] [CrossRef] [Google Scholar]
- Talbi, D., & Herbst, E. 2001, A&A, 376, 663 [NASA ADS] [CrossRef] [EDP Sciences] [Google Scholar]
- Talbi, D., Hickman, A. P., Kashinski, D., Malenda, R. F., & Redondo, P. 2009, J. Phys. Conf. Ser., 192, 012014 [NASA ADS] [CrossRef] [Google Scholar]
- Teyssier, D., Hily-Blant, P., Gerin, M., et al. 2005, ESA SP, 577, 423 [NASA ADS] [Google Scholar]
- Thaddeus, P., Gottlieb, C. A., Gupta, H., et al. 2008, ApJ, 677, 1132 [NASA ADS] [CrossRef] [Google Scholar]
- Tokudome, T., Sakai, N., Sakai, T., Takano, S., & Yamamoto, S. 2013, ASP Conf. Ser., 476, 355 [NASA ADS] [Google Scholar]
- Troscompt, N., Faure, A., Maret, S., et al. 2009, A&A, 506, 1243 [NASA ADS] [CrossRef] [EDP Sciences] [Google Scholar]
- Turner, B. E. 2001, ApJS, 136, 579 [Google Scholar]
- Turner, B. E., Herbst, E., & Terzieva, R. 2000, ApJS, 126, 427 [NASA ADS] [CrossRef] [Google Scholar]
- van der Tak, F. F. S., Black, J. H., Schöier, F. L., Jansen, D. J. M., & van Dishoeck, E. F. 2007, A&A, 468, 627 [NASA ADS] [CrossRef] [EDP Sciences] [Google Scholar]
- Vrtilek, J. M., Gottlieb, C. A., Gottlieb, E. W., Killian, T. C., & Thaddeus, P. 1990, ApJ, 364, L53 [NASA ADS] [CrossRef] [Google Scholar]
- Wakelam, V., Loison, J.-C., Herbst, E., et al. 2015, ApJS, 217, 20 [NASA ADS] [CrossRef] [Google Scholar]
- Ward-Thompson, D., Motte, F., & Andre, P. 1999, MNRAS, 305, 143 [NASA ADS] [CrossRef] [Google Scholar]
- Wiesenfeld, L., & Faure, A. 2013, MNRAS, 432, 2573 [NASA ADS] [CrossRef] [Google Scholar]
- Wu, Q., Hao, Q., Wilke, J. J., et al. 2010, J. Chem. Theory Comput., 6, 3122 [CrossRef] [Google Scholar]
All Tables
All Figures
|
Fig. 1 Spectra of H2CCC and HDCCC observed towards TMC-1C with the IRAM 30 m telescope. The integration times for H2CCC were 3 h at 82 and 83 GHz, 4 h at 102 GHz, and 23 h at 103 GHz. For HDCCC the integration time was 16 h. |
| In the text | |
|
Fig. 2 Spectra of H2CCC and HDCCC observed towards L1544 with the IRAM 30 m telescope. The integration times were 4 h for H2CCC and 9.6 h for HDCCC. |
| In the text | |
|
Fig. 3 Fundamental transitions of HDCCC and H2CCC in TMC-1. Also present in the upper panel is the hyperfine-split transition of C6H in the lower Λ component (e) at 20792.872 and 20792.945 MHz. Partially resolved kinematic structure is seen in the lines of HDCCC and C6H, but not in H2CCC owing to the lower S/N. The dashed line at + 5.8 km s-1 indicates the systemic velocity of TMC-1. The integration time was approximately 11.5 h for the HDCCC and 12 min for the H2CCC spectrum. Both spectra were Hanning-smoothed to a frequency resolution of 6.1 kHz. A similar spectrum was observed by Cernicharo et al. (1987), see Fig. 2 lower left panel in their paper, and Fossé et al. (2001), see Fig. 1 upper panel. In the paper by Cernicharo et al. (1987), the line of H2CCC was reported as an unidentified feature because the laboratory spectrum of H2CCC was not known yet. |
| In the text | |
|
Fig. 4 D/H isotopic ratio in the carbene isomers H2CCC and c-C3H2 in three dense cores in the Taurus molecular cloud: TMC-1, TMC-1C, and L1544. For c-C3H2, the heights of the bars indicate the average value, and the error bars the range of values inferred in previous studies of TMC-1 (Turner 2001) and of TMC-1C and L1544 (Spezzano et al. 2013). |
| In the text | |
|
Fig. 5 Integrated area (W) for the 41,4−31,3 transition (blue contour) and 51,5−41,4 transition (red contour) of H2CCC, and the ratio of the integrated areas R54 (solid black contour) versus the total column density of ortho H2CCC and the H2 density. |
| In the text | |
|
Fig. 6 Dependence of the excitation temperature (Tex) of the 41,4−31,3 and 51,5−41,4 transitions of ortho H2CCC on the column density and the H2 density, on the assumption that the kinetic temperature is 10 K. The colour scale applies to the 41,4−31,3 transition and the dashed contours to the 51,5−41,4 transition. |
| In the text | |
|
Fig. 7 Dependence of the optical depths (τ) of the 41,4−31,3 and 51,5−41,4 transitions of ortho H2CCC on the column density and the H2 density. |
| In the text | |
Current usage metrics show cumulative count of Article Views (full-text article views including HTML views, PDF and ePub downloads, according to the available data) and Abstracts Views on Vision4Press platform.
Data correspond to usage on the plateform after 2015. The current usage metrics is available 48-96 hours after online publication and is updated daily on week days.
Initial download of the metrics may take a while.