Fig. 3
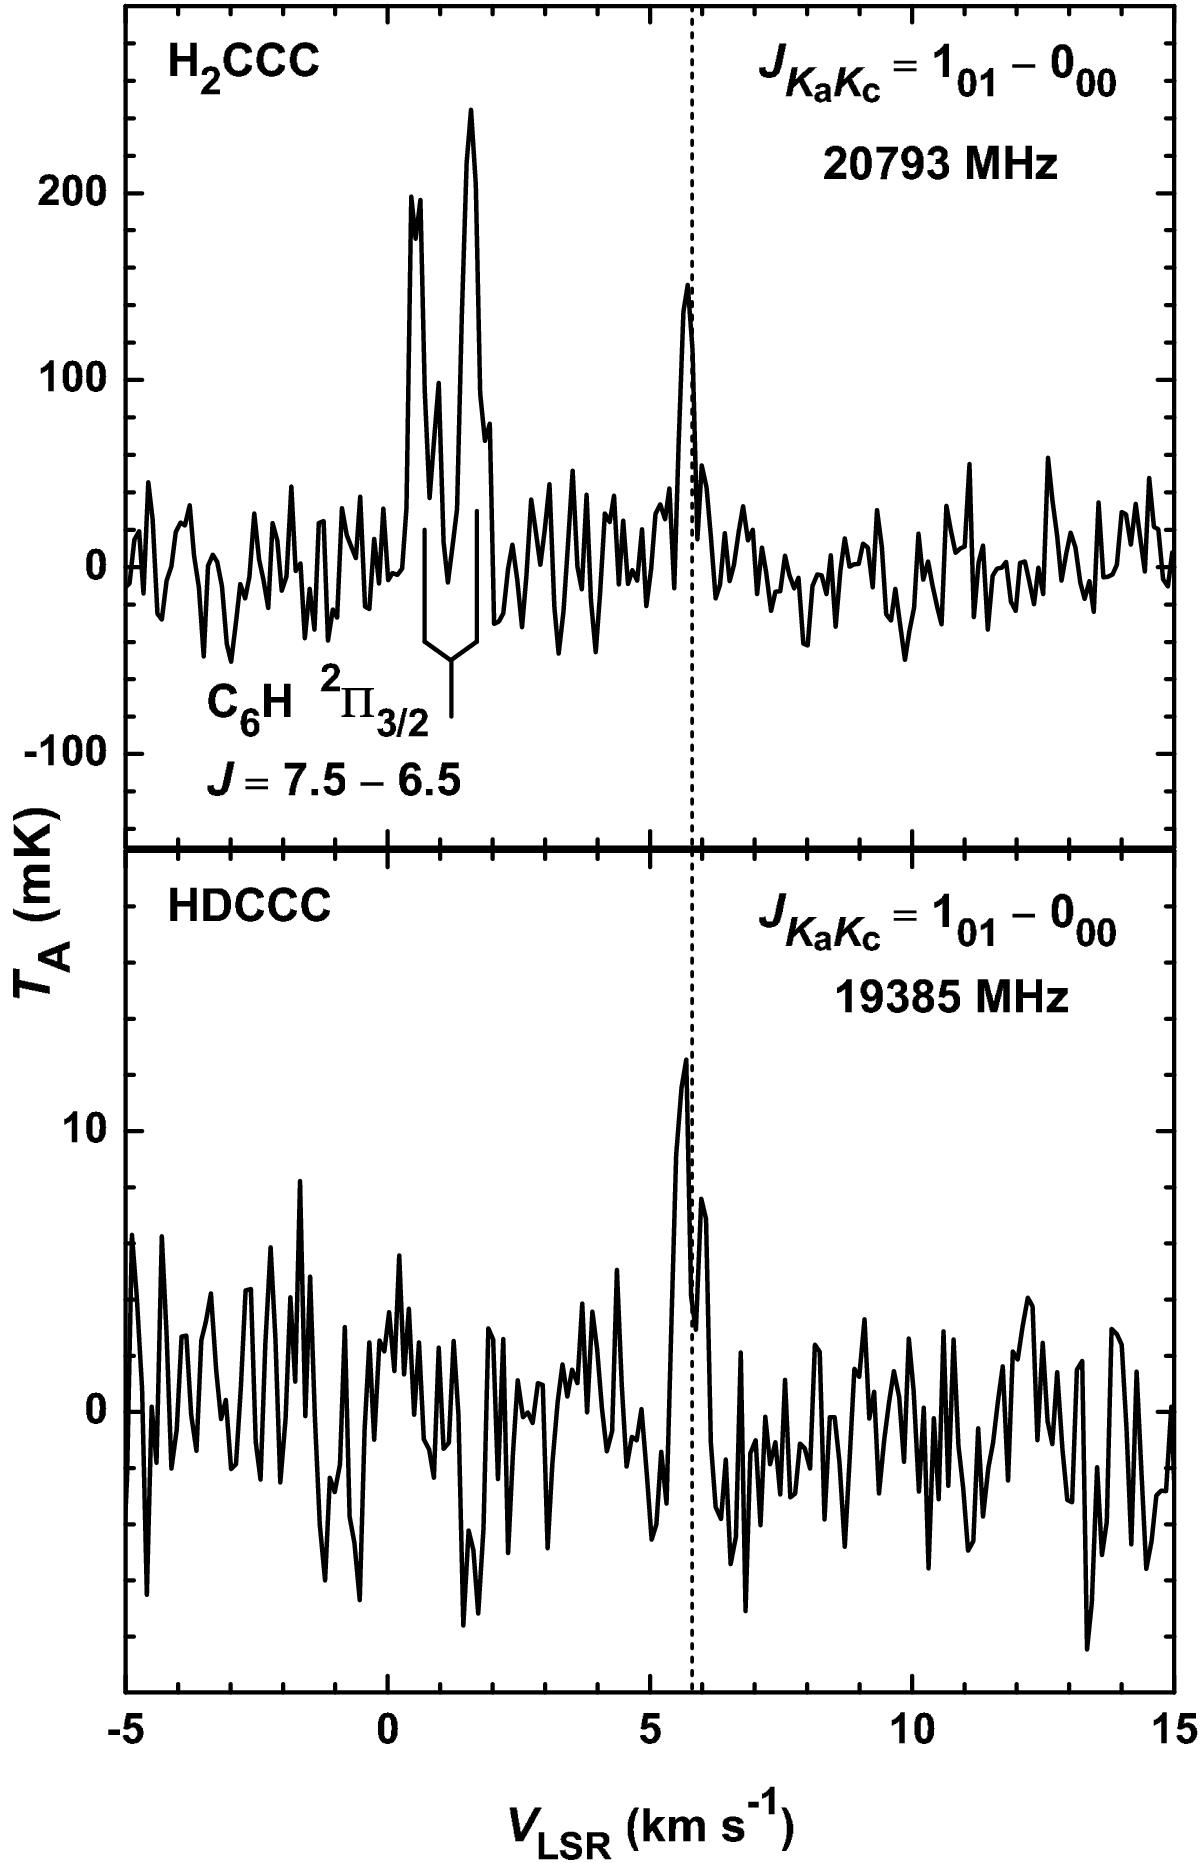
Fundamental transitions of HDCCC and H2CCC in TMC-1. Also present in the upper panel is the hyperfine-split transition of C6H in the lower Λ component (e) at 20792.872 and 20792.945 MHz. Partially resolved kinematic structure is seen in the lines of HDCCC and C6H, but not in H2CCC owing to the lower S/N. The dashed line at + 5.8 km s-1 indicates the systemic velocity of TMC-1. The integration time was approximately 11.5 h for the HDCCC and 12 min for the H2CCC spectrum. Both spectra were Hanning-smoothed to a frequency resolution of 6.1 kHz. A similar spectrum was observed by Cernicharo et al. (1987), see Fig. 2 lower left panel in their paper, and Fossé et al. (2001), see Fig. 1 upper panel. In the paper by Cernicharo et al. (1987), the line of H2CCC was reported as an unidentified feature because the laboratory spectrum of H2CCC was not known yet.
Current usage metrics show cumulative count of Article Views (full-text article views including HTML views, PDF and ePub downloads, according to the available data) and Abstracts Views on Vision4Press platform.
Data correspond to usage on the plateform after 2015. The current usage metrics is available 48-96 hours after online publication and is updated daily on week days.
Initial download of the metrics may take a while.