Fig. 6
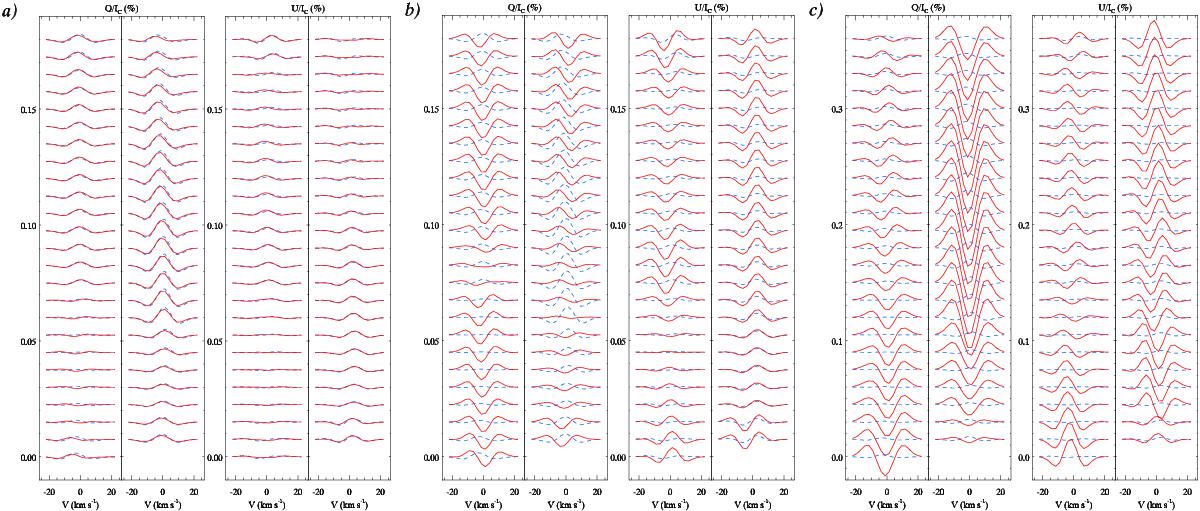
Comparison of the synthetic LSD Stokes QU profiles predicted by different ZDI inversions. In each panel the dashed line shows the linear polarisation profiles for Model 2. The solid lines correspond to a) Model 1; b) Model 3; and c) Model 4. The Stokes QU spectra are shown for the same set of rotational phases as the Stokes V profiles in Figs. 1 and 2.
Current usage metrics show cumulative count of Article Views (full-text article views including HTML views, PDF and ePub downloads, according to the available data) and Abstracts Views on Vision4Press platform.
Data correspond to usage on the plateform after 2015. The current usage metrics is available 48-96 hours after online publication and is updated daily on week days.
Initial download of the metrics may take a while.