Free Access
Fig. 5
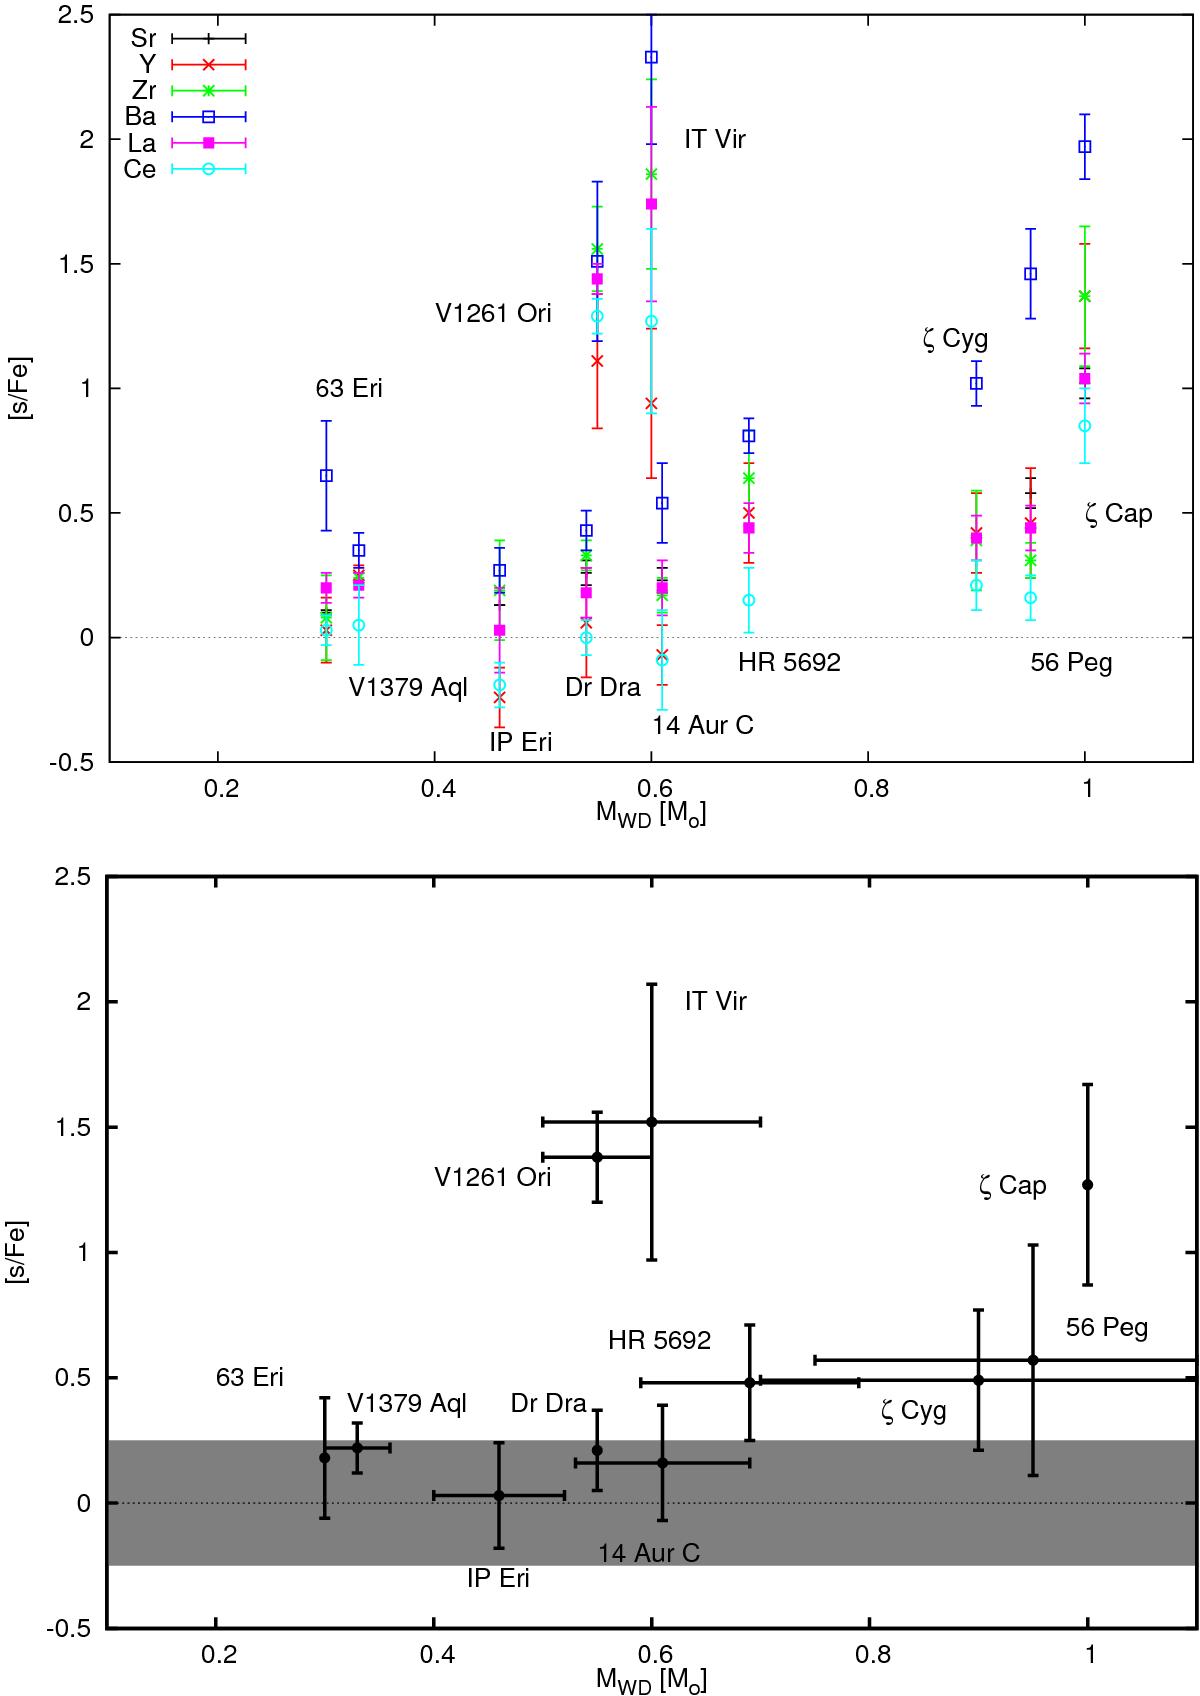
Upper panel: first- (Sr, Y, Zr) and second-peak (Ba, La, Ce) s-process abundances relative to Fe as a function of the WD mass. Lower panel: same as upper panel, but with mean s-process abundances relative to Fe. To guide the eye, the grey zone shows the ±0.25 dex zone without significant enhancement in s-process abundances.
This figure is made of several images, please see below:
Current usage metrics show cumulative count of Article Views (full-text article views including HTML views, PDF and ePub downloads, according to the available data) and Abstracts Views on Vision4Press platform.
Data correspond to usage on the plateform after 2015. The current usage metrics is available 48-96 hours after online publication and is updated daily on week days.
Initial download of the metrics may take a while.