| Issue |
A&A
Volume 586, February 2016
|
|
|---|---|---|
| Article Number | L5 | |
| Number of page(s) | 5 | |
| Section | Letters | |
| DOI | https://doi.org/10.1051/0004-6361/201526892 | |
| Published online | 27 January 2016 | |
A newly discovered stellar type: dusty post-red giant branch stars in the Magellanic Clouds
1 Instituut voor Sterrenkunde, K.U.Leuven, Celestijnenlaan 200D bus 2401, 3001 Leuven, Belgium
e-mail: This email address is being protected from spambots. You need JavaScript enabled to view it.
2 Research School of Astronomy and Astrophysics, Mount Stromlo Observatory, Weston Creek, ACT 2611, Australia
3 Key Laboratory of Optical Astronomy, National Astronomical Observatories, Chinese Academy of Sciences, 100012 Beijing, PR China
Received: 3 July 2015
Accepted: 16 December 2015
Abstract
Context. We present a newly discovered class of low-luminosity, dusty, evolved objects in the Magellanic Clouds. These objects have dust excesses, stellar parameters, and spectral energy distributions similar to those of dusty post-asymptotic giant branch (post-AGB) stars. However, they have lower luminosities and hence lower masses. We suggest that they have evolved off the red giant branch (RGB) instead of the AGB as a result of binary interaction.
Aims. In this study we aim to place these objects in an evolutionary context and establish an evolutionary connection between RGB binaries (such as the sequence E variables) and our new sample of objects.
Methods. We compared the theoretically predicted birthrates of the progeny of RGB binaries to the observational birthrates of the new sample of objects.
Results. We find that there is order-of-magnitude agreement between the observed and predicted birthrates of post-RGB stars. The sources of uncertainty in the birthrates are discussed; the most important sources are probably the observational incompleteness factor and the post-RGB evolution rates. We also note that mergers are relatively common low on the RGB and that stars low on the RGB with mid-IR excesses may recently have undergone a merger.
Conclusions. Our sample of dusty post-RGB stars most likely provides the first observational evidence for a newly discovered phase in binary evolution: post-RGB binaries with circumstellar dust.
Key words: binaries: general / stars: evolution / Magellanic Clouds / methods: observational / methods: numerical
© ESO, 2016
1. Introduction
The evolutionary fate of a star on the giant branches (the red giant branch [RGB] and the asymptotic giant branch [AGB]) significantly depends on whether the star evolves via a single or a binary evolutionary channel.
The nuclear-burning lives of single low- to intermediate-mass stars are terminated during the AGB phase when a super-wind with mass-loss rates of up to 10-4 M⊙ yr-1 reduces the hydrogen envelope to low values (≲10-2 M⊙, see Schönberner 1983; Vassiliadis & Wood 1993). Subsequently, within ~102−104 years, the star evolves to higher temperatures through the post-AGB phase (defined approximately as the temperature range from the AGB to 104 K) with an almost constant luminosity. Single post-AGB stars are surrounded by the expanding dusty matter that is expelled by the stellar wind. The stellar photospheric emission is absorbed by the dust in the wind and is re-emitted, leading to stars with high mid-IR excess. See Van Winckel (2003) for a review of the post-AGB phase. Beyond the post-AGB phase, when Teff≳ 2 × 10⁴ K, the star passes through the planetary nebula (PN) and white dwarf (WD) phases.
For low- to intermediate-mass stars in binary systems a different mechanism can terminate AGB evolution. The large expansion that occurs when the star is on the AGB can cause the primary star to overflow its Roche lobe. The evolutionary outcome depends primarily on the time at which the star fills its Roche lobe. A star that reaches the tip of the AGB without filling its Roche lobe will evolve as a single star does, resulting in the formation of a PN central star on a wide orbit (Moe & De Marco 2006). For a star that fills its Roche lobe on the AGB, a common envelope (CE) event usually occurs, which results in either a close binary or a stellar merger (Ivanova et al. 2013). Alternatively, for a small range of mass ratios, stable mass transfer via Roche lobe overflow can occur, leading to the formation of an intermediate-period binary. Post-AGB stars surrounded by circumbinary discs are most likely examples of such systems (Van Winckel et al. 2009).
Stars in binary systems not only interact while on the AGB, but can also interact while on the RGB, which results in large amounts of mass loss, followed by evolution off the RGB (e.g. Han et al. 2002; Nie et al. 2012). Here, the outcome of a CE event is thought to be either a close binary containing a low-mass He-core white dwarf or a core-He burning subdwarf B star (Webbink 1984; Heber 2009), or a stellar merger in which the secondary star merges with the red giant envelope. The merged star will evolve further as a more massive single star, initially with a dusty circumstellar envelope left over from the merger process. Roche-lobe filling can also lead to RGB termination by stable mass transfer for a small range of mass ratios. In this case, subsequent evolution beyond the RGB is to higher Teff values at near-constant luminosity (Driebe et al. 1998), initially through the post-RGB phase, which is defined approximately as the temperature range from the RGB to Teff ≈ 104 K.
All of the above-mentioned theoretical scenarios agree well with those borne out by population-synthesis models of Han et al. (2002) and Nie et al. (2012). Although these evolution schemes seem straightforward, there is little understanding from first principles of the different important physical processes that govern these binary interaction processes. To fully understand single and binary stellar evolution, observations of systems that have just evolved off the AGB and RGB are essential.
In this Letter we report on the first observational evidence for objects that appear to be dusty post-RGB systems. We aim to place these objects into the context of binary evolution and compare the observed sample to the predictions of population synthesis models that simulate the fate of binary red giants.
2. Low-luminosity, dusty post-RGB sample
We have carried out an extensive search for optically bright dusty post-AGB candidates in the Magellanic Clouds. We performed an extensive low-resolution optical spectral survey with the AAOmega multi-fibre spectrograph mounted on the Anglo Australian telescope, which resulted in a clean sample of well-characterised objects with spectroscopically determined stellar parameters (Teff, log g, [Fe/H] and E [B−V]) spanning a wide range in luminosities in the Small Magellanic Cloud (SMC; Kamath et al. 2014, Paper I) and the Large Magellanic Cloud (LMC; Paper II Kamath et al. 2015).
The known distances to the Magellanic Clouds enabled luminosity estimates for all the objects, which led to one of the most important results of this survey: the unexpected discovery of a group of evolved, dusty objects with luminosities lower than the RGB tip luminosity (~2500 L⊙). We found 42 such objects in the SMC (Paper I) and 119 such objects in the LMC (Paper II). These objects have mid-IR excesses and stellar parameters (other than luminosity) similar to those of post-AGB stars. They are of A − K spectral types, low log g (mostly between 0 and 2 with a small number of the hotter, lower luminosity objects having log g up to 3), and with metallicities lower than the mean metallicity of young stars in their host galaxy. Because of their relatively low luminosity (100−2500 L⊙), it is likely that these objects are dusty post-RGB stars whose evolution was terminated by binary mass transfer or by a merger when the star was dusty and on the RGB. Figure 1 shows the positions of our dusty LMC and SMC post-RGB objects in the HR-diagram.
In the Galaxy, dusty single and binary objects assumed to be post-AGB stars have been observationally well studied. However, the unknown distances and hence luminosities do not allow for the identification of possible dusty post-RGB stars among these objects. Therefore, our Magellanic Cloud objects are the first examples of such systems.
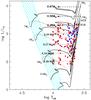 |
Fig. 1 Positions of the LMC (red filled circles) and SMC (blue filled squares) post-RGB candidates on the HR diagram. The main-sequence is represented as a cyan and grey cross-hatched region. The black solid lines represent evolutionary tracks starting from the main sequence and continuing up to the AGB-tip with an initial composition Y = 0.23, Z = 0.004 (Bertelli et al. 2008, 2009). The black dotted lines represent PMS evolutionary tracks for an initial composition Y = 0.238, Z = 0.004 (Tognelli et al. 2011). The masses of the evolutionary tracks are indicated in the plots, with the pre-main-sequence and main-sequence masses shown on the left side of the main-sequence band and the RGB-tip masses on the right side of the plots. The black dashed arrows schematically represent the post-AGB and post-RGB evolutionary tracks (the masses of the post-AGB and post-RGB stars are given at the arrow ends). The masses for the post-AGB evolutionary tracks are taken fromVassiliadis & Wood (1994). The post-RGB evolutionary track masses are estimated from the RGB luminosity-core mass relation obtained from fits to the evolutionary tracks of Bertelli et al. (2008). |
3. Interloping objects in other evolutionary stages
Other classes of objects that have luminosities similar to those of our dusty post-RGB candidates are intermediate-mass core-He burning (IM-CHeB) stars, dusty pre-main-sequence (PMS) stars and early-AGB (EAGB) stars. These objects are potential interlopers contaminating our post-AGB and post-RGB sample. Each class of potential interlopers is considered below.
-
1.
IM-CHeB stars: the core-He burning phase is not predictedto involve heavy mass-loss, and hence stars in this phase are notexpected to have circumstellar dust, contrary to the situation forstars in our sample. Furthermore, the metallicity distribution ofour post-RGB objects peaks at a lower value (Z ≈ 0.0016) than thetypical metallicity of young stars in the host galaxies (Z ≈ 0.004 inthe SMC and 0.008 in the LMC), while the metallicty distributionof IM-CHeB stars is expected to peak at the typical metallicityof the young stars. This implies that our objects are of lower mass(older) than IM-CHeB stars. In addition, our objects have rela-tively low log g values. If these stars were IM-CHeBstars, then they would be ~8−12 times more massive than post-RGBstars at the same luminosity (see Fig. 1) and wouldtherefore have a log g higher by ~1. This is not consistent with our derived log gvalues. In summary, for the above three reasons, it seems unlikelythat IM-CHeB stars can explain our objects.
-
2.
PMS stars: Although PMS stars have mid-IR excesses and luminosities similar to stars in our sample, at a given luminosity, the mass of a PMS star is about 15−20 times that of the corresponding post-RGB star (see Fig. 1), leading to a difference of ~1.2 in log g between PMS and post-RGB stars. This gravity difference allowed us to separate the two classes of objects (see Papers I and II for full details). Supporting evidence for our separation of PMS and post-RGB stars is provided by the low metallicity of our post-RGB objects compared to the typical metallicity of young stars in the host galaxies.
-
3.
EAGB stars: Stars with 5 ≳ M ≳ 1.85 M⊙ can fill their Roche lobes and produce post-EAGB stars at luminosities similar to that of our objects (100 L⊙ up to the low-mass RGB tip at ~2500 L⊙). These intermediate-mass stars do not form degenerate cores or reach high luminosities on their RGB, so that they attain larger radii and can fill their Roche lobes during their higher luminosity EAGB phase. It is therefore possible that there are some post-EAGB objects in our sample. Moreover, since the thermally pulsing AGB starts below 2500 L⊙ for M ≲ 2.2 M⊙, a few post-AGB stars with 2.2 ≳ M ≳ 1.85 M⊙ may be included. We note that an EAGB star of low mass (M ≲ 1.85 M⊙) and with a luminosity lower that the RGB tip will have been larger during its RGB evolution at the same or have had higher luminosities, so that if binary interaction occurs, it will happen on the RGB and not the EAGB. For M ≳ 5 M⊙, the EAGB phase is more luminous than 2500 L⊙.
4. Connection to RGB binary population models
To place the newly discovered dusty post-RGB systems in an evolutionary context, it is important to understand their formation channels and establish connections to possible precursors and progeny. Based on their low luminosities, we expect that the objects reside in binary systems since single-star mass loss that occurs during the RGB phase is insufficient to remove the H-rich envelope and produce a dusty post-RGB star (e.g. Vassiliadis & Wood 1993). Therefore, we consider binary formation channels to explain their evolution off the RGB.
It is by now well established that variable giants form distinct sequences in the period-luminosity (P-L) diagram as discovered first in the LMC by Wood et al. (1999). One of the sequences, sequence-E, is associated with close-binary red giants that show ellipsoidal light variations (Nicholls et al. 2010). The red giants in these systems are about to fill their Roche lobes, leading to a CE event or some less catastrophic mass transfer to the binary companion. Population-synthesis models normalised to the population of sequence-E ellipsoidal binaries in the LMC (Nie et al. 2012) can be used to predict the birthrate of post-RGB, post-EAGB stars and mergers on the RGB relative to the number of red giant stars in the LMC. Here, we try to establish an evolutionary connection between the sequence-E stars and post-RGB stars by comparing the theoretically predicted birthrates from Nie et al. (2012) with the observationally determined birthrates of our new sample of dusty post-RGB stars. Since the population-synthesis models of Nie et al. (2012) are normalised to the population of sequence-E binaries in the LMC, we perform the comparison only for the LMC.
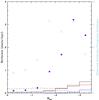 |
Fig. 2 Luminosity distributions showing the comparison between the total observed birthrates (stars per 1000 years) at luminosities below the RGB tip (post-RGB plus post-EAGB stars) and the predicted rates of production. The purple dots are the observed birthrates, the black solid line represents the total predicted rate of production, which is made up of the post-RGB production rate (red line) and the post-EAGB production rate (blue line). The light blue open circles show the ratio of the observed to the total predicted birthrate. The green dashed line represents the birthrate of mergers on the RGB. |
First, we obtained predicted birthrates from the models of Nie et al. (2012). We used their standard model, which is normalized to the Soszynski et al. (2004) sequence-E data for the LMC. This model of Nie et al. (2012) gives, in arbitrary units, the relative birthrates of post-RGB stars (br−prgb), post-EAGB stars (br−peagb), stellar mergers of the RGB (br−mergers) and stars passing through the tip of the RGB (br−tiprgb). Nie et al. (2012) found that stars take 2.77 × 10⁶ years to evolve through the top 1 magnitude of the RGB, so that the number of stars we expect to see at any given time in this magnitude interval is n−topmag = 2.77 × 10⁶ × br−tiprgb. The actual total number of stars observed in the top 1 magnitude of the RGB in the fields searched for post-RGB stars is 118927 (see Paper II). Hence, the total birthrates of post-RGB and post-EAGB stars predicted by the models in the observed fields are br−prgb × (118927 /n−topmag) and br−eagb × (118927 /n−topmag), respectively. These birthrates, in half-magnitude bins, are shown in Fig. 2 along with their sum, which represents the total birthrate. We note that the post-RGB birthrate dominates the post-EAGB birthrate, although the latter increases to about 25% of the total birthrate at the highest luminosities. We also show in Fig. 2 is the birthrate for mergers on the RGB. Mergers are more common at lower luminosities.
Next, we estimated the total observational birthrate of post-RGB stars in our LMC fields. To do this, we divided the number of observed post-RGB stars (in luminosity bins of half a magnitude) by the estimated evolutionary lifetime in each bin. The evolutionary lifetime was obtained using the post-RGB evolutionary tracks of Driebe et al. (1998). A feature of post-RGB (and post-AGB) evolutionary tracks is that they speed up dramatically as the envelope mass becomes low and the star moves from the RGB to higher Teff. We rather arbitrarily assumed that the post-RGB phase starts at log Teff = log Teff(RGB) + 0.05 and continues to log Teff = 4. Our observed samples of LMC post-RGB stars used to calculate birthrates were selected from the full sample using this selection criterion. This resulted in 68 out of 119 objects. The objects closer to the RGB (the remaining 51 objects, see Fig. 1) could be merged objects. To obtain corresponding lifetimes, we extracted evolutionary times from the post-RGB evolutionary tracks of Driebe et al. (1998) for the interval log Teff(RGB) + 0.05 < log Teff< 4. We note that the Driebe et al. (1998) tracks include some mass loss, which will cause a speed up of the evolution rate compared to the rate for a post-RGB star that has no external mass loss.
By dividing the observed number of stars in each luminosity bin by the evolutionary lifetime for that bin, we derived a partial observational birthrate. As noted in Paper II, our search for post-AGB and post-RGB stars is incomplete since we took spectra of only a fraction of the possible candidates. We found 119 post-RGB candidates, but estimated that there are another 751 post-RGB candidates in the whole LMC. Our observed fields contain only 56% of the whole LMC input catalogue, therefore we expect 0.56 × 751 = 421 additional post-RGB candidates in our observed fields. Hence, to obtain an observational estimate of the total post-RGB birthrates for our observed fields, we need to multiply each partial observational birthrate by a factor of (421+119)/119 = 4.5. These final observed post-RGB birthrates are shown as large solid points in Fig. 2.
It is clear from Fig. 2 that the observationally estimated post-RGB birthrate is higher than the theoretically predicted birthrate, especially at higher luminosities. We find that the average ratio of observed to predicted birthrate is 6.0. There are various possibilities that could explain this discrepancy, and we discuss each of these below.
-
1.
An over-estimation of the incompleteness factor: Using resultsfrom Paper II, we estimated that our observed post-RGB samplewas incomplete by the large factor of 4.5. The uncertainty in thiscompleteness factor could explain a significant part of thediscrepancy.
-
2.
An underestimate of the post-RGB evolution time: the Driebe et al. (1998) evolutionary tracks include mass loss given by a Reimers (1975)-type law which, in the middle of the luminosity range considered here (log L/L⊙ = 2.6) and at log Teff = 3.75, is essentially identical to the rate of consumption of the hydrogen-rich envelope by nuclear burning. Since the evolution rate is proportional to the rate of reduction of the envelope mass by the combination of mass loss and nuclear burning, our post-RGB lifetimes could be too short by a factor of ~2 if post-RGB stars have no mass loss. If they have mass re-accretion from a circumbinary disk, which is often observed in Galactic post-AGB binaries (e.g. Van Winckel 2003), then our assumed post-RGB lifetimes could be shorter by an even larger factor, and our observational birthrates will be over-estimated by the same factor.
-
3.
Uncertainties in the model post-RGB birthrate: The population of sequence-E stars in the LMC is well determined by OGLE monitoring (Soszynski et al. 2004). These stars are about to fill their Roche lobes, and their evolution up the RGB on nuclear timescales is relatively simple. For this reason we chose these stars and the modelling of Nie et al. (2012) as a way to derive a reasonably accurate birthrate estimate for post-RGB stars. We considered all stars that fill their Roche lobes on the RGB as the precursors of our post-RGB stars. In practice, it is likely that only a fraction of the Roche-lobe-filling stars are the precursors of post-RGB stars because it is possible that the stars that undergo CE evolution on filling their Roche lobes will transit rapidly to log Teff> 4 and will not form part of our observational sample. Thus our birthrates estimated from the models are likely over-estimates and not the under-estimates required if we are to match the observed birthrates. Modelling the uncertainties can therefore probably not explain the discrepancy between the observed and predicted post-RGB star birthrates. We note that although we have only mentioned post-RGB stars in this discussion, we implicitly included the post-EAGB component of the population.
-
4.
Contamination of our post-RGB sample by interlopers especially PMS stars. As discussed in Sect. 3, contamination is probably not a significant problem.
-
5.
Our choice of log Teff(RGB) + 0.05 as the lower limit for log Teff of post-RGB stars. We tested this by repeating our calculations using log Teff(RGB) + 0.1 as the lower limit for log Teff and found an average ratio of observed to predicted birthrate of 7.3 instead of 6.0. Therefore, our choice of the lower limit for log Teff does not greatly influence the discrepancy.
A related possible problem for our post-RGB objects, at least at the lower luminosities, is their expected lifetime as they evolve from the RGB to log Teff = 4. According to the tracks of Driebe et al. (1998), this lifetime is ~103 years for the highest luminosity RGB stars and nearly 108 years for the lowest luminosity objects in our sample. The possible problem with this lifetime is the requirement that dust remain in the vicinity of the post-RGB stars while they evolve to log Teff = 4. However, we note that in a typical post-AGB binary, the dust is in a circumbinary disk (Van Winckel et al. 2009) with a long potential lifetime, and we expect a similar situation to apply for post-RGB stars. Until studies of the lifetimes of such disks are made, we cannot conclude whether the long evolutionary lifetimes are a problem.
In light of the above discussion, we think the discrepancy between the observed post-RGB birthrate estimate and the model birthrate estimate is most likely due to the uncertainty in our incompleteness factor and to uncertainties in the post-RGB evolution rate. It is highly desirable that a larger sample of mid-infrared-selected post-RGB candidates be examined spectroscopically to improve the incompleteness factor for post-RGB stars in the LMC. It is also desirable that more post-RGB and post-EAGB evolutionary tracks be made with modern input physics and for a range of mass loss and mass re-accretion rates to better determine the post-RGB evolution timescale.
Finally, we note that low on the RGB in Fig. 2, the birthrate of mergers exceeds the birthrate of binary post-RGB stars. Such stars are likely to eject part of their envelope during the merger process, and they might be expected to show a mid-IR excess for some time. Our post-RGB sample was selected because of a mid-IR excess, so it is possible that those stars in our sample that are close to the RGB in Teff (see Fig. 2) have recently undergone a merger.
5. Conclusions
We presented a new population of evolved, dusty, low-luminosity, low-metallicity, low log g post-RGB stars in the Magellanic Clouds. These objects are very similar to post-AGB binaries, except that they have lower luminosities (and hence masses), and they are very likely to have evolved off the RGB via binary interaction. We compared the observed birthrate of the post-RGB sample to the predictions from population-synthesis models of Nie et al. (2012), which were normalised to the LMC population of sequence-E ellipsoidal binaries on the RGB.
We found that there is order-of-magnitude agreement between the observed and predicted birthrates of post-RGB stars given the uncertainties involved, the most important uncertainty being the incompleteness factor in the observed sample of post-RGB stars and our poor knowledge of post-RGB evolution rates. We therefore conclude that our dusty post-RGB stars are very likely to represent a newly discovered phase of binary stellar evolution. We also note that mergers are relatively common low on the RGB and that stars low on the RGB with mid-IR excesses may have recently undergone a merger.
Acknowledgments
D.K. and H.V.W. acknowledge the support of the K.U. Leuven contract GOA/13/012. D.K. acknowledges the support of the F.W.O. grant G.OB86.13. P.R.W. has received support from the Australian Research Council Discovery Project DP120103337.
References
- Bertelli, G., Girardi, L., Marigo, P., & Nasi, E. 2008, A&A, 484, 815 [NASA ADS] [CrossRef] [EDP Sciences] [Google Scholar]
- Bertelli, G., Nasi, E., Girardi, L., & Marigo, P. 2009, A&A, 508, 355 [NASA ADS] [CrossRef] [EDP Sciences] [Google Scholar]
- Driebe, T., Schoenberner, D., Bloecker, T., & Herwig, F. 1998, A&A, 339, 123 [Google Scholar]
- Han, Z., Podsiadlowski, P., Maxted, P. F. L., Marsh, T. R., & Ivanova, N. 2002, MNRAS, 336, 449 [NASA ADS] [CrossRef] [Google Scholar]
- Heber, U. 2009, ARA&A, 47, 211 [NASA ADS] [CrossRef] [Google Scholar]
- Ivanova, N., Justham, S., Chen, X., et al. 2013, A&ARv, 21, 59 [Google Scholar]
- Kamath, D., Wood, P. R., & Van Winckel, H. 2014, MNRAS, 439, 2211 [NASA ADS] [CrossRef] [Google Scholar]
- Kamath, D., Wood, P. R., & Van Winckel, H. 2015, MNRAS, 454, 1468 [NASA ADS] [CrossRef] [Google Scholar]
- Moe, M., & De Marco, O. 2006, ApJ, 650, 916 [NASA ADS] [CrossRef] [Google Scholar]
- Nicholls, C. P., Wood, P. R., & Cioni, M.-R. L. 2010, MNRAS, 405, 1770 [NASA ADS] [Google Scholar]
- Nie, J. D., Wood, P. R., & Nicholls, C. P. 2012, MNRAS, 423, 2764 [NASA ADS] [CrossRef] [Google Scholar]
- Reimers, D. 1975, in Problems in stellar atmospheres and envelope (New York: Springer-Verlag), 229 [Google Scholar]
- Schönberner, D. 1983, ApJ, 272, 708 [NASA ADS] [CrossRef] [Google Scholar]
- Soszynski, I., Udalski, A., Kubiak, M., et al. 2004, Acta Astron., 54, 347 [NASA ADS] [CrossRef] [Google Scholar]
- Tognelli, E., Prada Moroni, P. G., & Degl’Innocenti, S. 2011, A&A, 533, A109 [NASA ADS] [CrossRef] [EDP Sciences] [Google Scholar]
- Van Winckel, H. 2003, ARA&A, 41, 391 [NASA ADS] [CrossRef] [Google Scholar]
- Van Winckel, H., Lloyd Evans, T., Briquet, M., et al. 2009, A&A, 505, 1221 [NASA ADS] [CrossRef] [EDP Sciences] [Google Scholar]
- Vassiliadis, E., & Wood, P. R. 1993, ApJ, 413, 641 [NASA ADS] [CrossRef] [Google Scholar]
- Vassiliadis, E., & Wood, P. R. 1994, ApJS, 92, 125 [NASA ADS] [CrossRef] [Google Scholar]
- Webbink, R. F. 1984, ApJ, 277, 355 [NASA ADS] [CrossRef] [Google Scholar]
- Wood, P. R., Alcock, C., Allsman, R. A., et al. 1999, in Asymptotic Giant Branch Stars, eds. T. Le Bertre, A. Lebre, & C. Waelkens, IAU Symp., 191, 151 [Google Scholar]
All Figures
|
Fig. 1 Positions of the LMC (red filled circles) and SMC (blue filled squares) post-RGB candidates on the HR diagram. The main-sequence is represented as a cyan and grey cross-hatched region. The black solid lines represent evolutionary tracks starting from the main sequence and continuing up to the AGB-tip with an initial composition Y = 0.23, Z = 0.004 (Bertelli et al. 2008, 2009). The black dotted lines represent PMS evolutionary tracks for an initial composition Y = 0.238, Z = 0.004 (Tognelli et al. 2011). The masses of the evolutionary tracks are indicated in the plots, with the pre-main-sequence and main-sequence masses shown on the left side of the main-sequence band and the RGB-tip masses on the right side of the plots. The black dashed arrows schematically represent the post-AGB and post-RGB evolutionary tracks (the masses of the post-AGB and post-RGB stars are given at the arrow ends). The masses for the post-AGB evolutionary tracks are taken fromVassiliadis & Wood (1994). The post-RGB evolutionary track masses are estimated from the RGB luminosity-core mass relation obtained from fits to the evolutionary tracks of Bertelli et al. (2008). |
| In the text | |
|
Fig. 2 Luminosity distributions showing the comparison between the total observed birthrates (stars per 1000 years) at luminosities below the RGB tip (post-RGB plus post-EAGB stars) and the predicted rates of production. The purple dots are the observed birthrates, the black solid line represents the total predicted rate of production, which is made up of the post-RGB production rate (red line) and the post-EAGB production rate (blue line). The light blue open circles show the ratio of the observed to the total predicted birthrate. The green dashed line represents the birthrate of mergers on the RGB. |
| In the text | |
Current usage metrics show cumulative count of Article Views (full-text article views including HTML views, PDF and ePub downloads, according to the available data) and Abstracts Views on Vision4Press platform.
Data correspond to usage on the plateform after 2015. The current usage metrics is available 48-96 hours after online publication and is updated daily on week days.
Initial download of the metrics may take a while.