Fig. 2
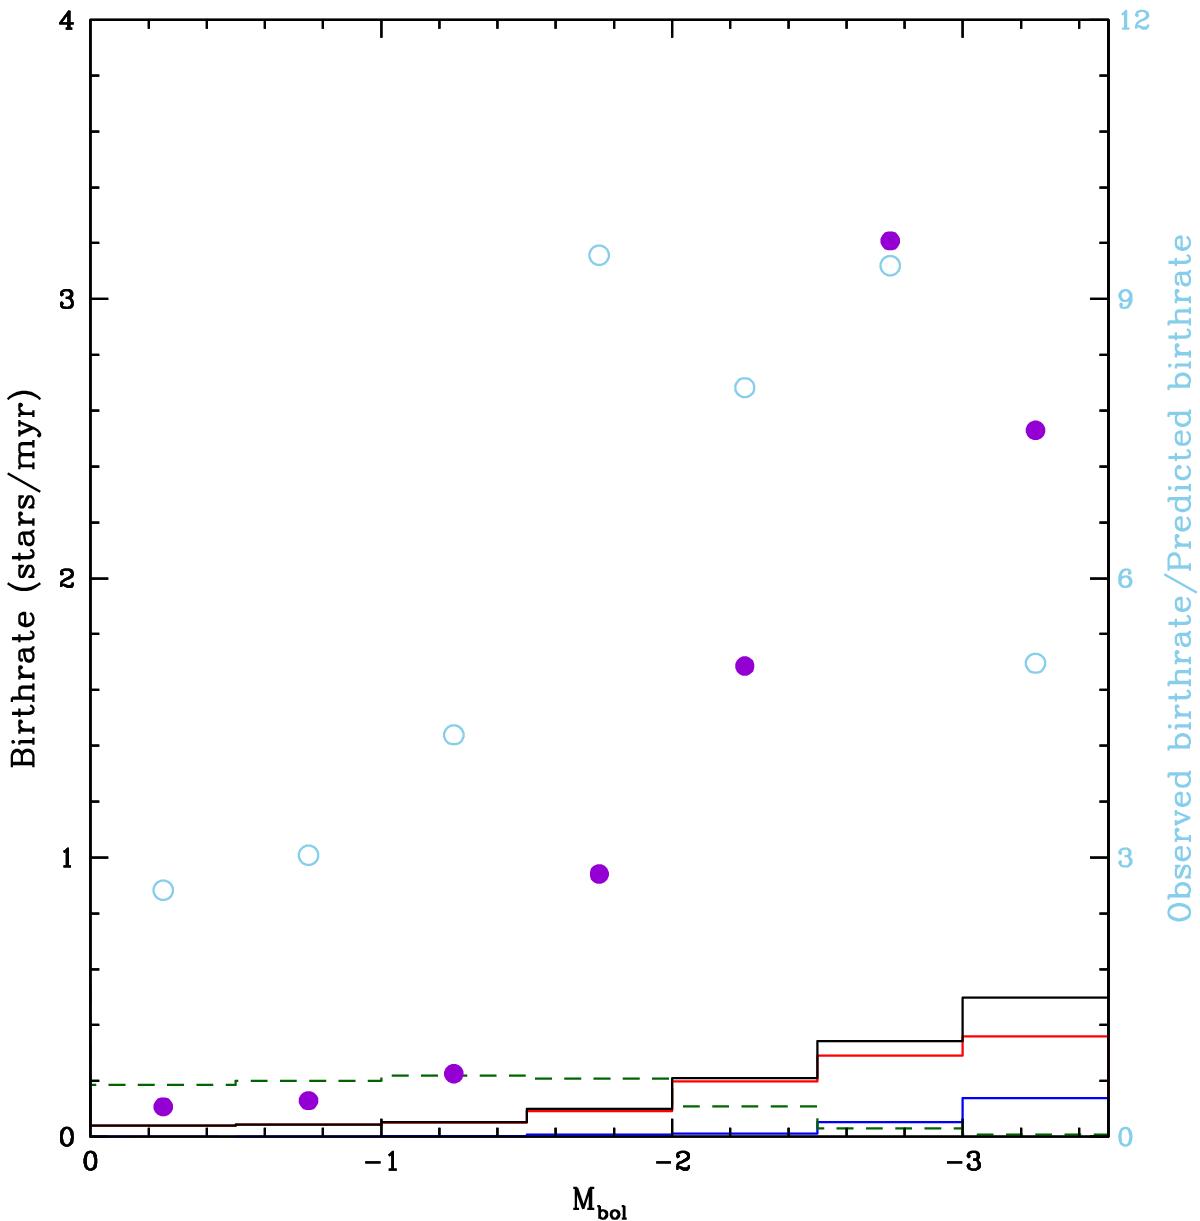
Luminosity distributions showing the comparison between the total observed birthrates (stars per 1000 years) at luminosities below the RGB tip (post-RGB plus post-EAGB stars) and the predicted rates of production. The purple dots are the observed birthrates, the black solid line represents the total predicted rate of production, which is made up of the post-RGB production rate (red line) and the post-EAGB production rate (blue line). The light blue open circles show the ratio of the observed to the total predicted birthrate. The green dashed line represents the birthrate of mergers on the RGB.
Current usage metrics show cumulative count of Article Views (full-text article views including HTML views, PDF and ePub downloads, according to the available data) and Abstracts Views on Vision4Press platform.
Data correspond to usage on the plateform after 2015. The current usage metrics is available 48-96 hours after online publication and is updated daily on week days.
Initial download of the metrics may take a while.