Fig. 1
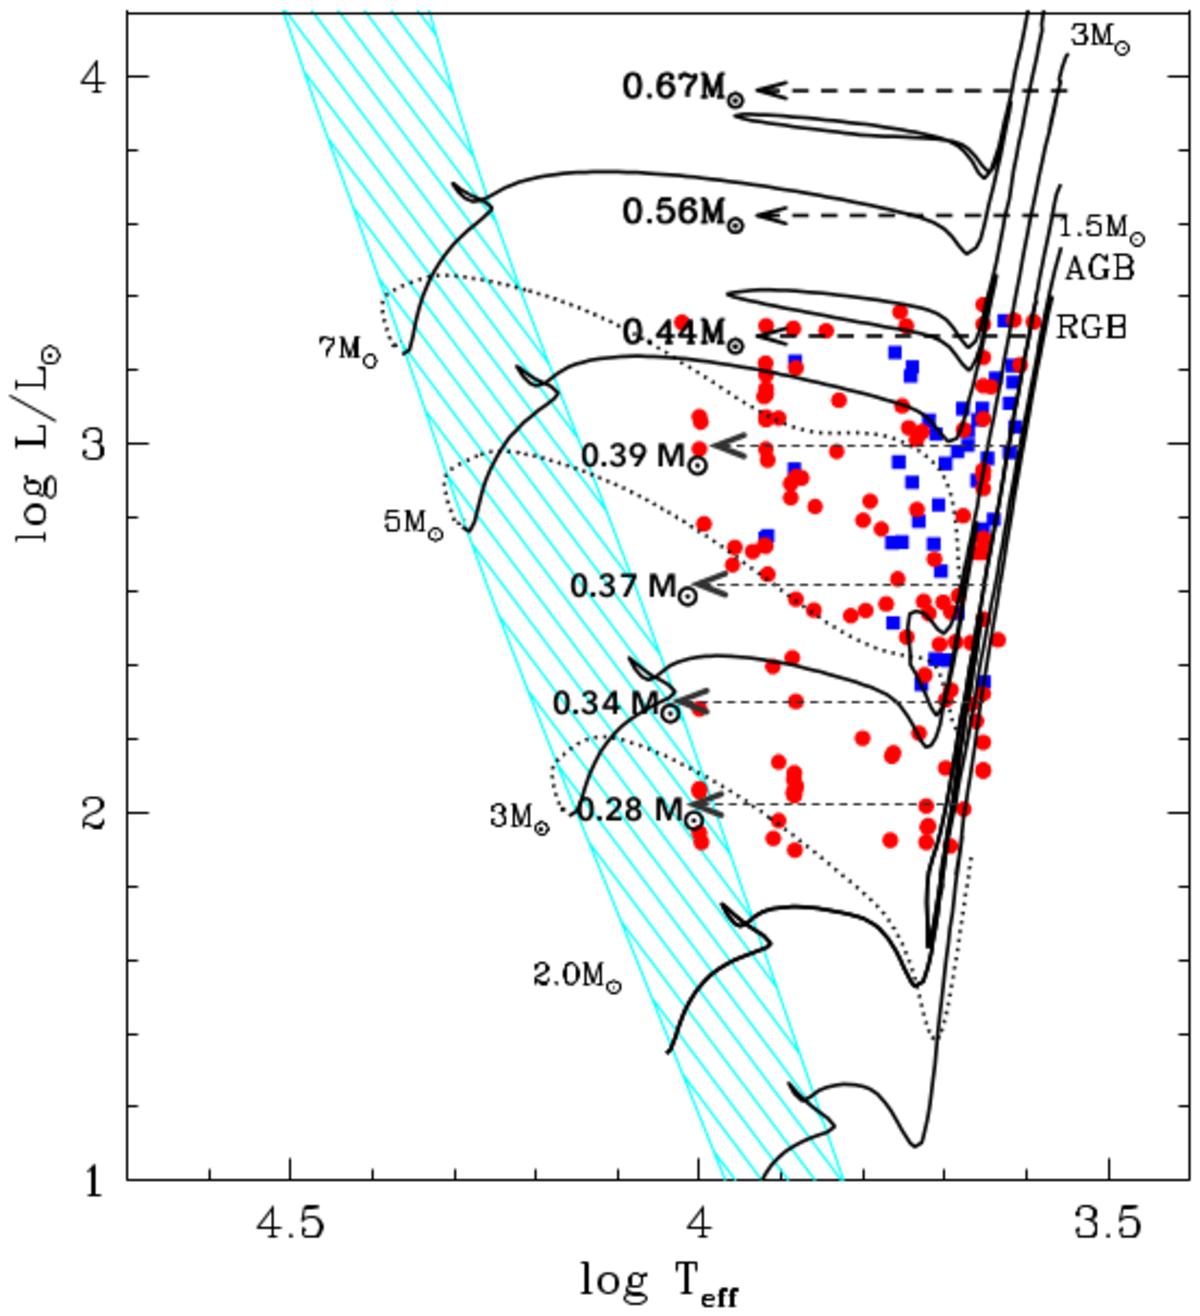
Positions of the LMC (red filled circles) and SMC (blue filled squares) post-RGB candidates on the HR diagram. The main-sequence is represented as a cyan and grey cross-hatched region. The black solid lines represent evolutionary tracks starting from the main sequence and continuing up to the AGB-tip with an initial composition Y = 0.23, Z = 0.004 (Bertelli et al. 2008, 2009). The black dotted lines represent PMS evolutionary tracks for an initial composition Y = 0.238, Z = 0.004 (Tognelli et al. 2011). The masses of the evolutionary tracks are indicated in the plots, with the pre-main-sequence and main-sequence masses shown on the left side of the main-sequence band and the RGB-tip masses on the right side of the plots. The black dashed arrows schematically represent the post-AGB and post-RGB evolutionary tracks (the masses of the post-AGB and post-RGB stars are given at the arrow ends). The masses for the post-AGB evolutionary tracks are taken fromVassiliadis & Wood (1994). The post-RGB evolutionary track masses are estimated from the RGB luminosity-core mass relation obtained from fits to the evolutionary tracks of Bertelli et al. (2008).
Current usage metrics show cumulative count of Article Views (full-text article views including HTML views, PDF and ePub downloads, according to the available data) and Abstracts Views on Vision4Press platform.
Data correspond to usage on the plateform after 2015. The current usage metrics is available 48-96 hours after online publication and is updated daily on week days.
Initial download of the metrics may take a while.