Fig. 6
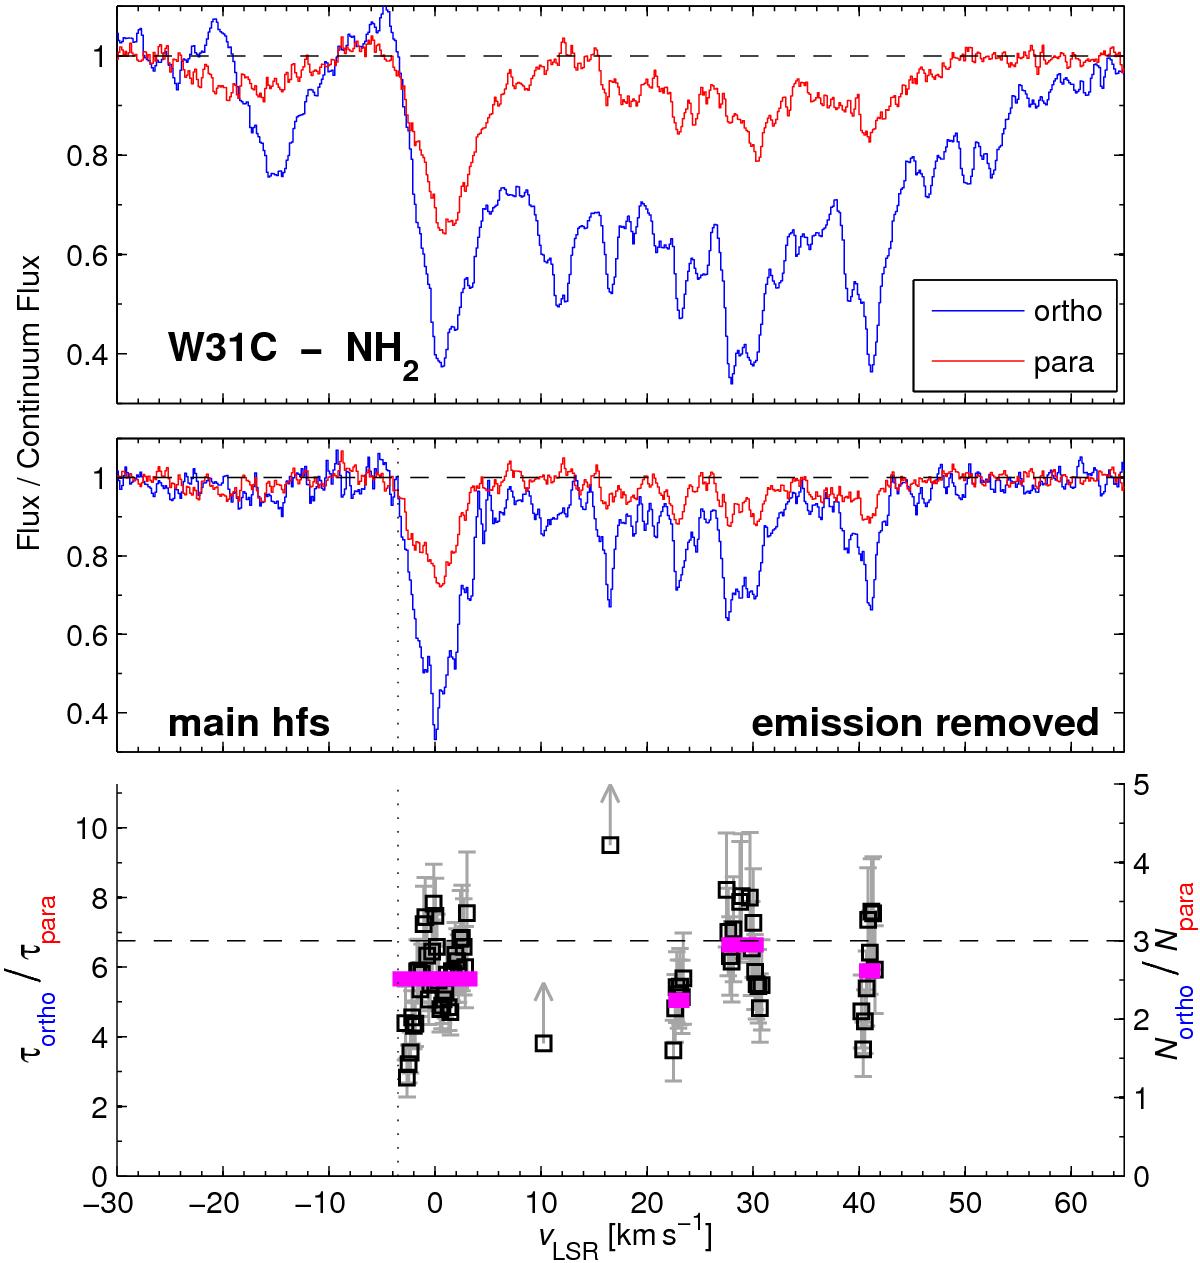
W31C. Upper: normalised spectra of the ortho 953 GHz and para 1444 GHz lines. Middle: deconvolved spectra where the strongest hfs component is plotted for both transitions. The hot core VLSR is marked with a dotted vertical line. Lower: the optical depth and column density ratios of the convolved spectra as functions of VLSR for absorptions larger than 5σ. The horizontal dashed line marks the high-temperature OPR limit of three. (Details are found in Sect. 3.4.)
Current usage metrics show cumulative count of Article Views (full-text article views including HTML views, PDF and ePub downloads, according to the available data) and Abstracts Views on Vision4Press platform.
Data correspond to usage on the plateform after 2015. The current usage metrics is available 48-96 hours after online publication and is updated daily on week days.
Initial download of the metrics may take a while.