Fig. A.13
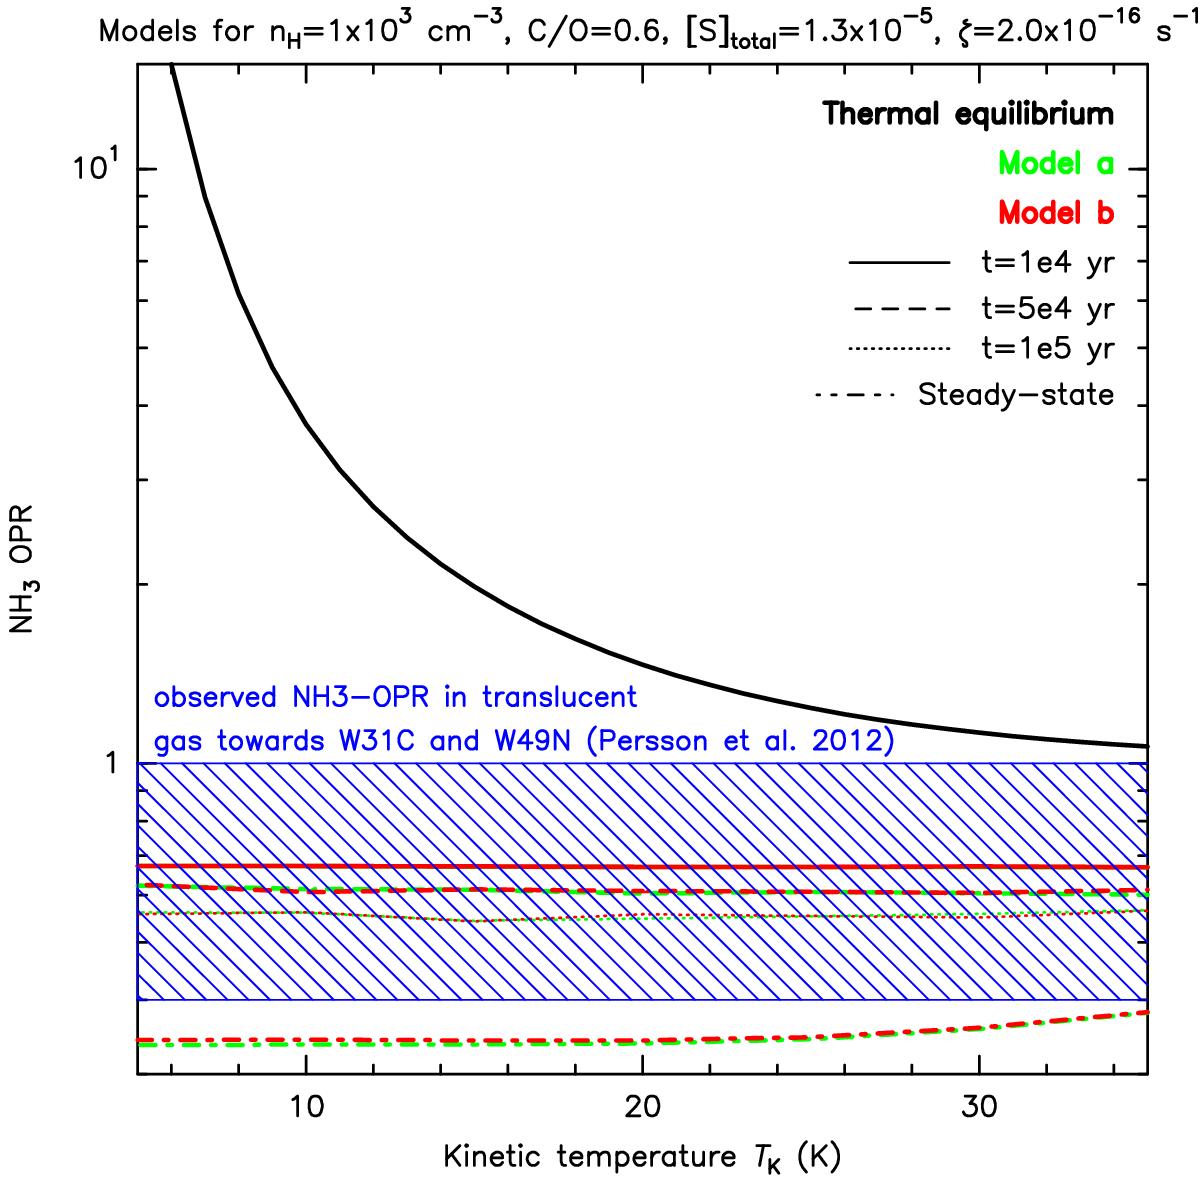
OPR of NH3 shown as a function of kinetic temperature for a density of nH = 1 × 103 cm-3: (i) at thermal equilibrium (black solid line); (ii) with model a (green) (details in Sect. 4.2); and (iii) with model b (red) (corresponding to model a plus the NH2 + H reaction, details in Sect. 4.3). The OPR is shown at four different times for both models: 1 × 10⁴ yr (solid lines), 5 × 10⁴ yr (dashed lines), 105 yr (dotted lines), and steady-state (dashed-dotted lines). The hatched box represents the OPR of NH3, including formal errors, in the translucent gas in the sight-lines towards W31C and W49N from (Persson et al. 2012).
Current usage metrics show cumulative count of Article Views (full-text article views including HTML views, PDF and ePub downloads, according to the available data) and Abstracts Views on Vision4Press platform.
Data correspond to usage on the plateform after 2015. The current usage metrics is available 48-96 hours after online publication and is updated daily on week days.
Initial download of the metrics may take a while.