Fig. A.9
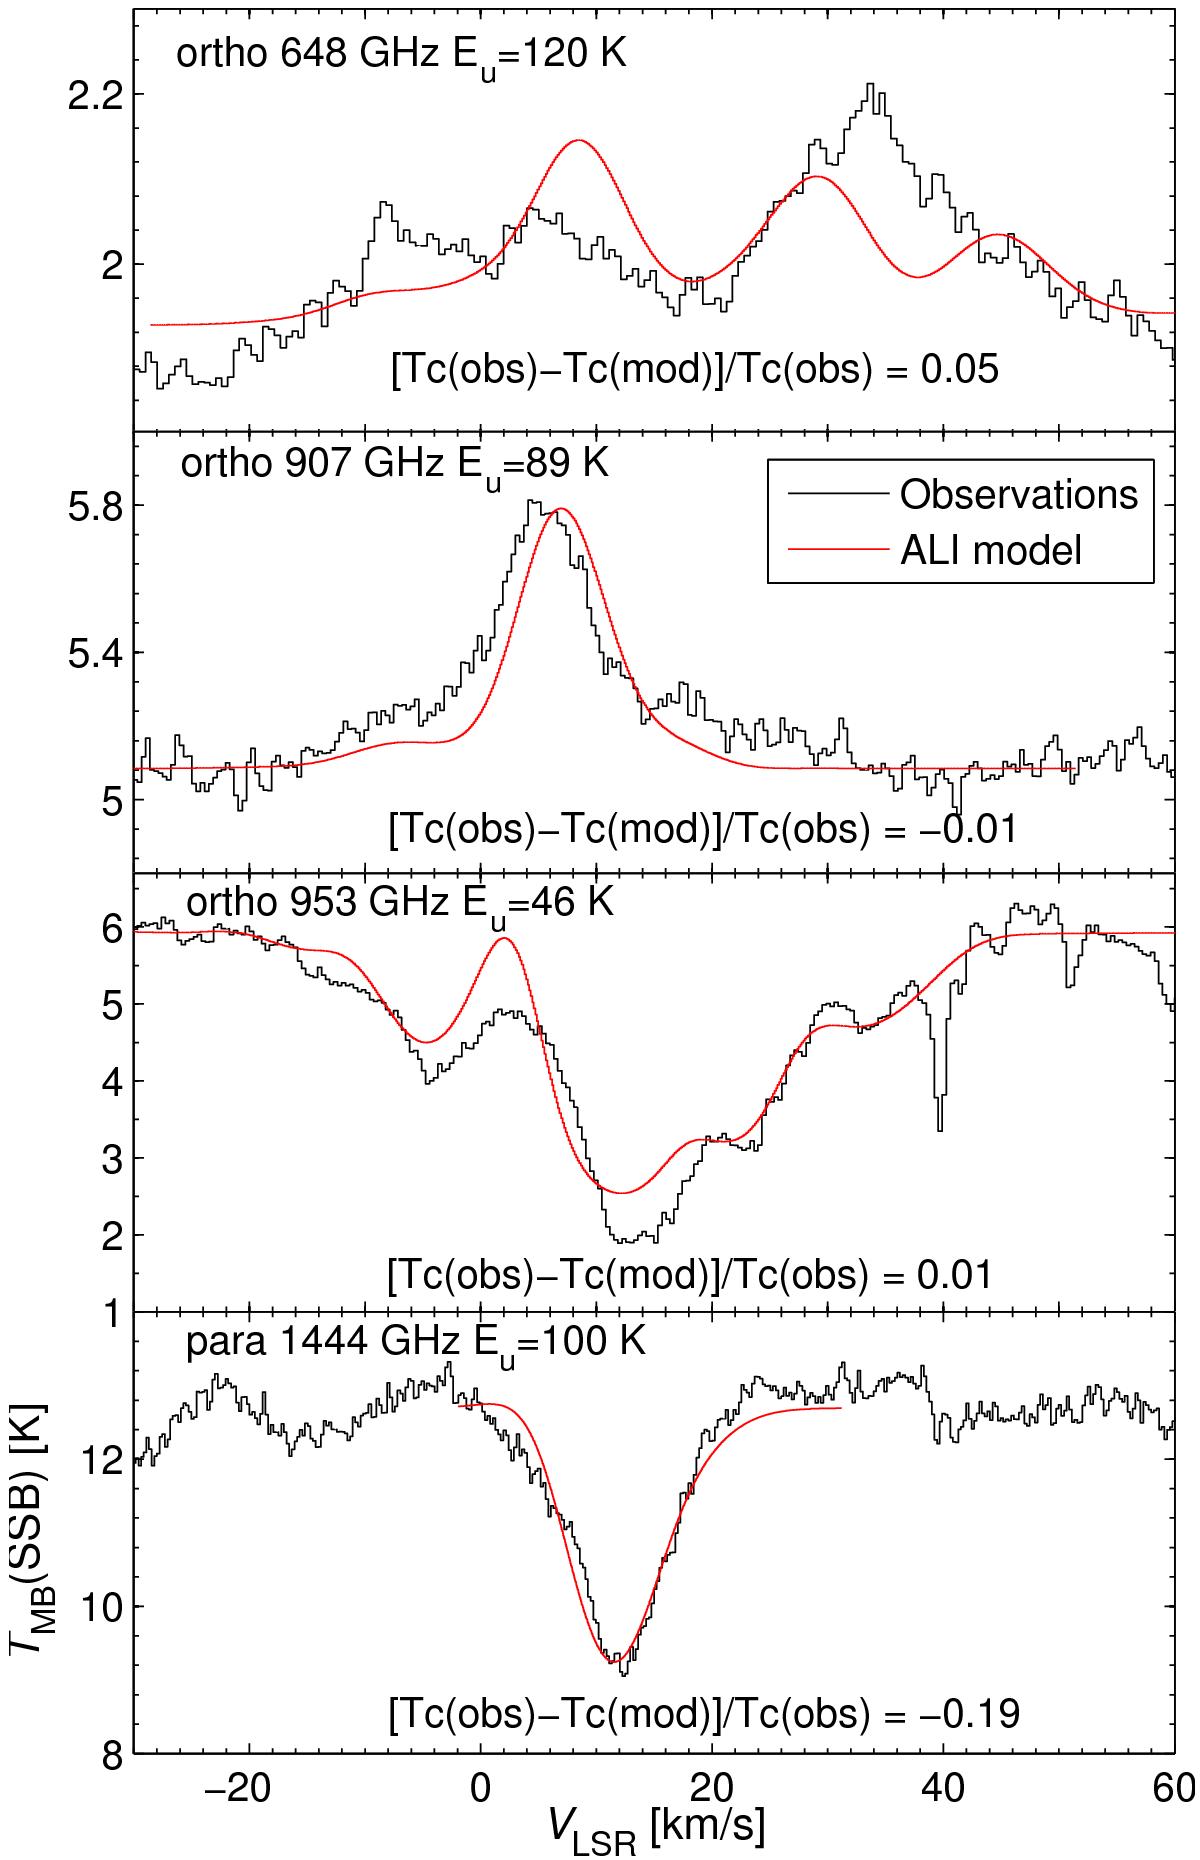
Example of a simple ALI model of the W49N hot core and the surrounding envelope (parameters are listed in Table B.7). The relative difference of the modelled and observed continuum at the frequency of each line is given in the respective legend. The 649 GHz line suffers from contamination from the image sideband and is used as an upper limit of its true intensity.
Current usage metrics show cumulative count of Article Views (full-text article views including HTML views, PDF and ePub downloads, according to the available data) and Abstracts Views on Vision4Press platform.
Data correspond to usage on the plateform after 2015. The current usage metrics is available 48-96 hours after online publication and is updated daily on week days.
Initial download of the metrics may take a while.