Fig. A.2
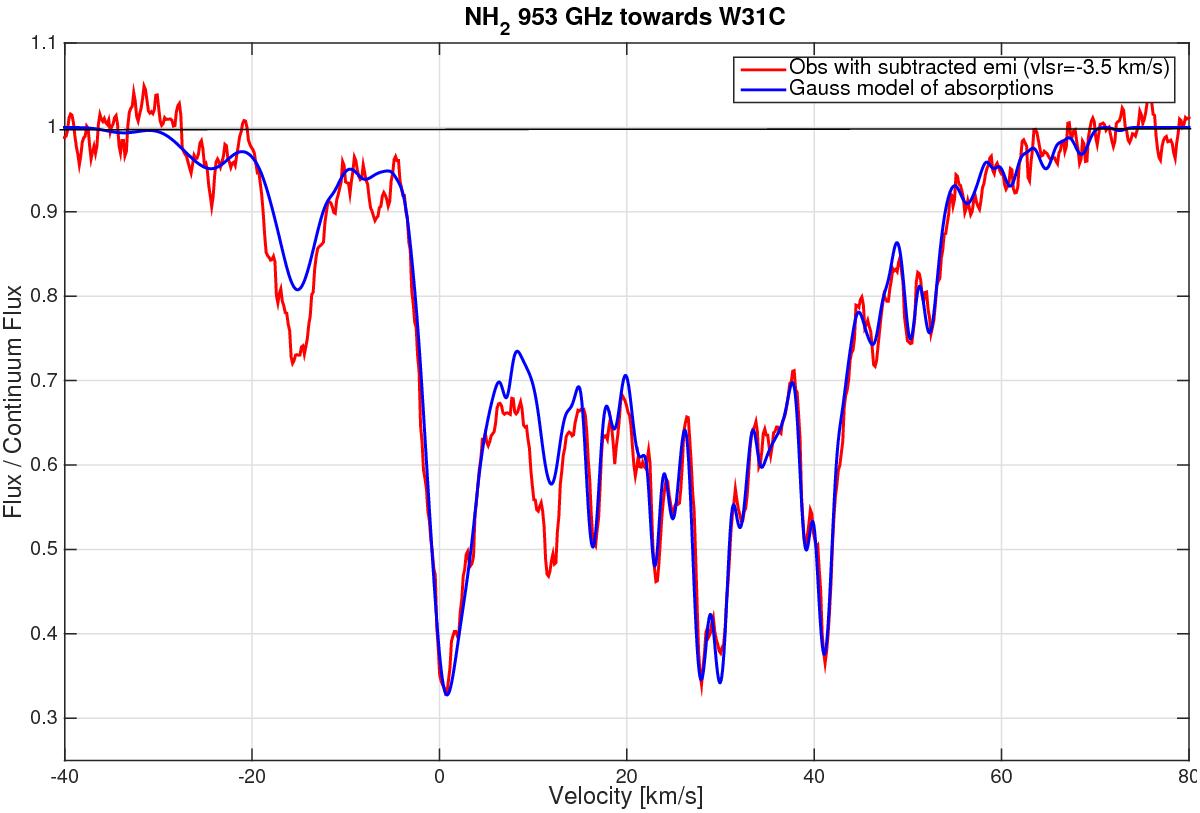
W31C. Red: original observations (channel separation 0.157 km s-1) with subtracted emission. Blue: Gaussian fits of all velocity (and hfs) components. Line widths and vLSR for each velocity component were taken from the results of the simultaneous Gaussian fitting of NH, ortho-NH2, and ortho-NH3 (method I, described in paper II).
Current usage metrics show cumulative count of Article Views (full-text article views including HTML views, PDF and ePub downloads, according to the available data) and Abstracts Views on Vision4Press platform.
Data correspond to usage on the plateform after 2015. The current usage metrics is available 48-96 hours after online publication and is updated daily on week days.
Initial download of the metrics may take a while.