Fig. 10
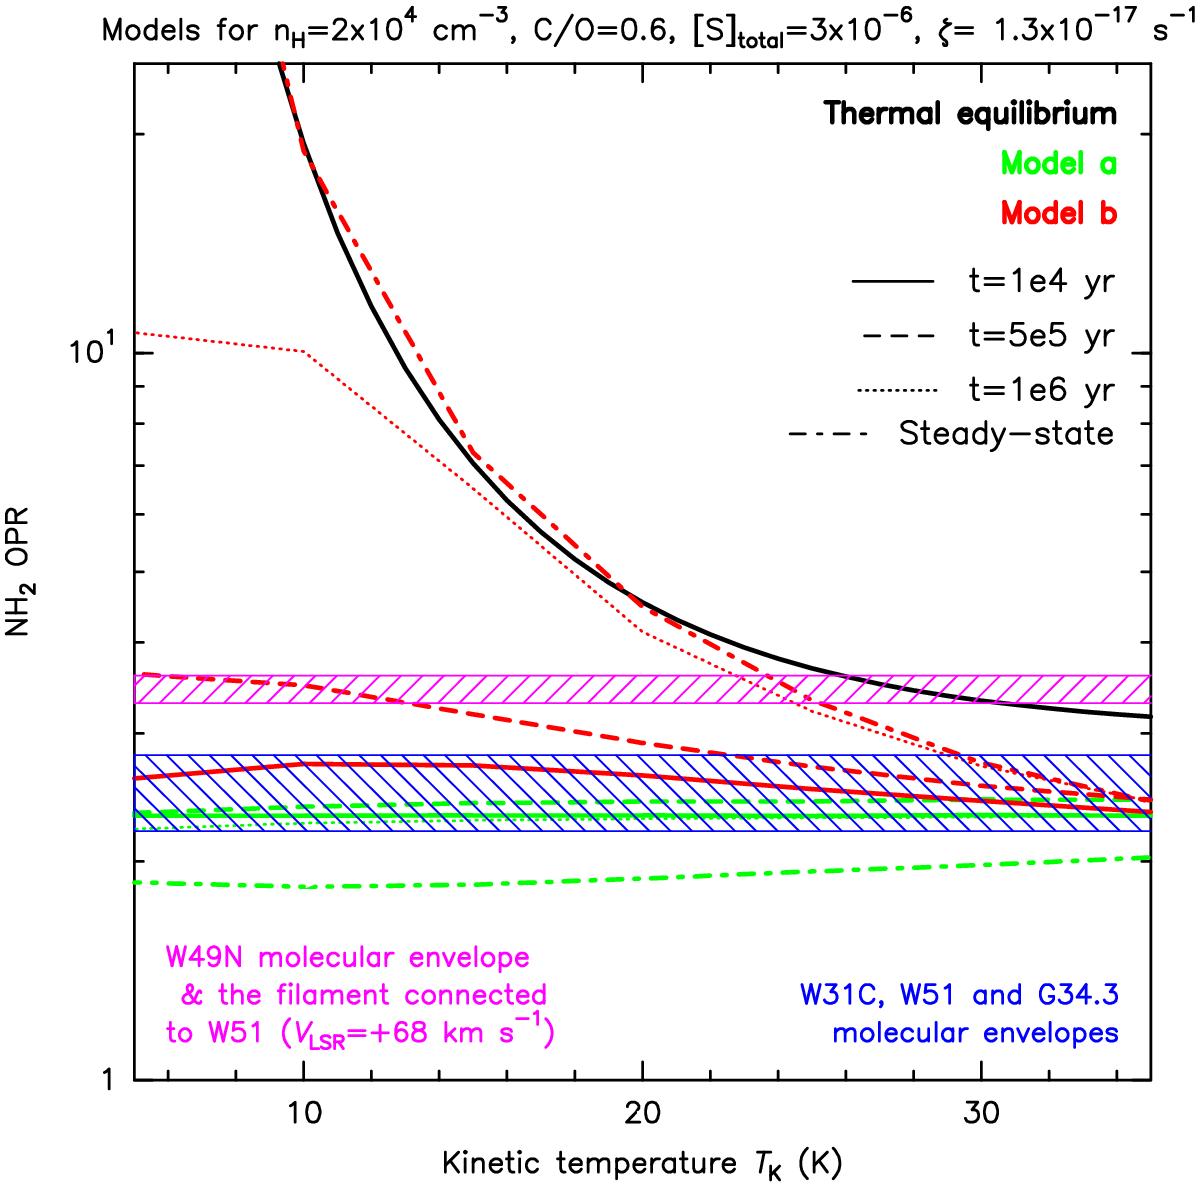
OPR of NH2 computed as a function of kinetic temperature for a density of nH = 2 × 104 cm-3: (i) at thermal equilibrium (black solid line); (ii) with model a (green, Sect. 4.2); and (iii) with model b (red, corresponding to model a plus the NH2 + H reaction, Sect. 4.3). The OPR is plotted at four different times for both models: 1 × 10⁴ yr (solid lines), 5 × 10⁵ yr (dashed lines), 106 yr (dotted lines), and steady-state (dashed-dotted lines). The hatched boxes represent our best estimates of the average OPR, including formal error bars. In blue we show the W31C, W51, and G34.3 molecular envelopes, and in pink the filament connected to W51 at VLSR ~ 68 km s-1 and the W49N molecular envelope.
Current usage metrics show cumulative count of Article Views (full-text article views including HTML views, PDF and ePub downloads, according to the available data) and Abstracts Views on Vision4Press platform.
Data correspond to usage on the plateform after 2015. The current usage metrics is available 48-96 hours after online publication and is updated daily on week days.
Initial download of the metrics may take a while.