Fig. A.1
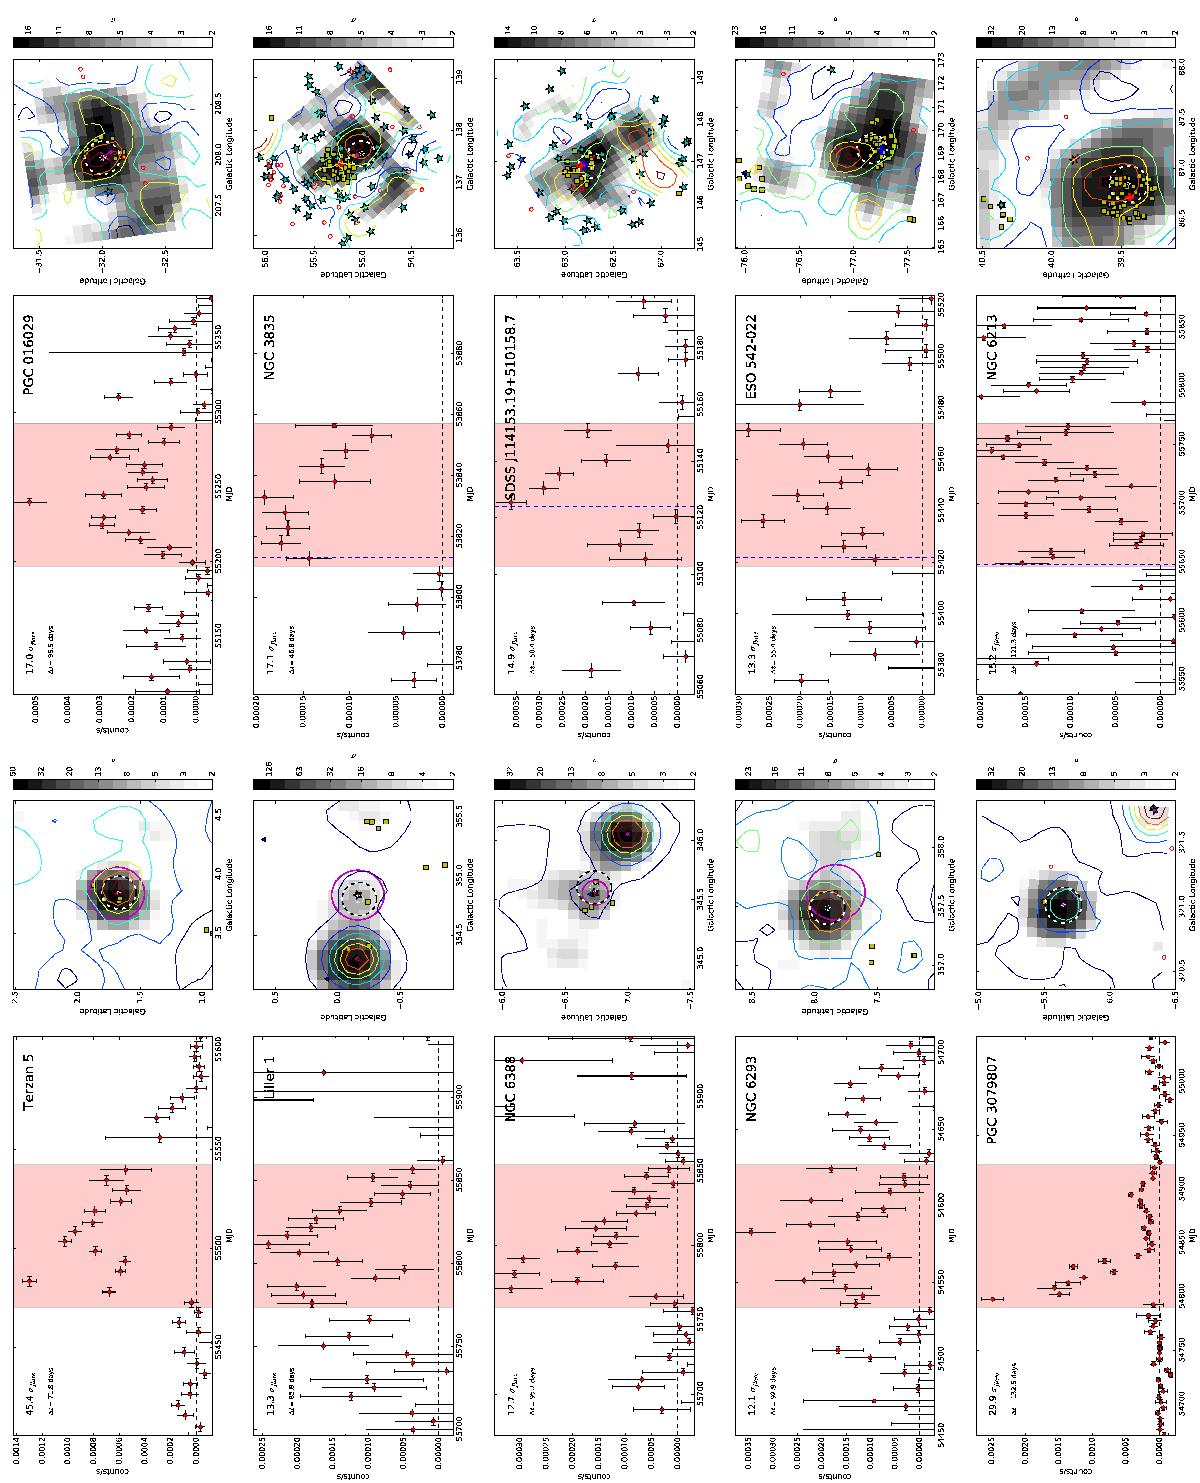
Left panels: the light curves derived at the position of the flares maximum, with red individual points with error bars, while the detected flare is shaded with red. If a GRB was detected nearby, a target galaxy vertical dashed line shows the time of the GRB. Right panels: significance images built over the flare period in logarithmic greyscale (the lower limit is fixed at 2σ). The associated GWGC galaxies are marked with red-filled circles, while other galaxies from the catalogue are shown with empty red circles. Cyan stars mark AGNs, yellow squares are XRT point sources, green diamonds show BAT galactic sources, blue triangles are Fermi sources, blue and red + show GRBs from Fermi and BAT, cyan x shows supernovae candidates, magenta x mark classical novae detections, red x code bright BAT sources, and magenta stars present BAT transients. The big black empty circle represents PSF fit with its radius equal sigma of the Gaussian (8.2 arcsec) with inner circle with radius equal to the error of the PSF. Magenta circles shows galaxy/globular cluster size if it was given in the catalogue. Overplotted contours are significance contours of the 8-year images.
Current usage metrics show cumulative count of Article Views (full-text article views including HTML views, PDF and ePub downloads, according to the available data) and Abstracts Views on Vision4Press platform.
Data correspond to usage on the plateform after 2015. The current usage metrics is available 48-96 hours after online publication and is updated daily on week days.
Initial download of the metrics may take a while.