Free Access
Fig. 4
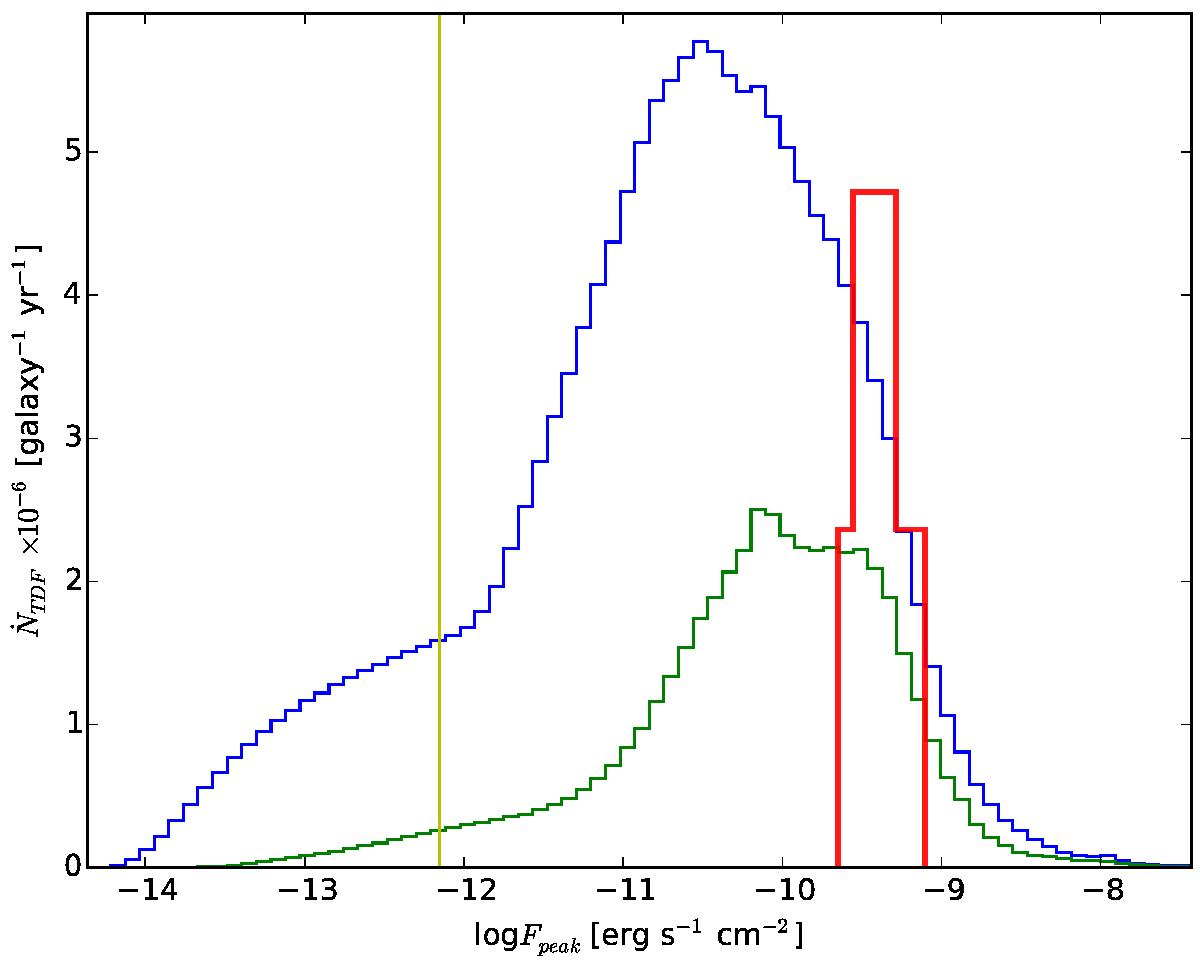
Expected distribution of peak fluxes for TDE in the GWGC for all black holes (blue) and only from those with masses in the range 106−7 M⊙ (green). The red histogram shows the TDE candidates detected by us. The vertical line shows the expected eRosita flare sensitivity at hard X-rays.
Current usage metrics show cumulative count of Article Views (full-text article views including HTML views, PDF and ePub downloads, according to the available data) and Abstracts Views on Vision4Press platform.
Data correspond to usage on the plateform after 2015. The current usage metrics is available 48-96 hours after online publication and is updated daily on week days.
Initial download of the metrics may take a while.