Fig. 2
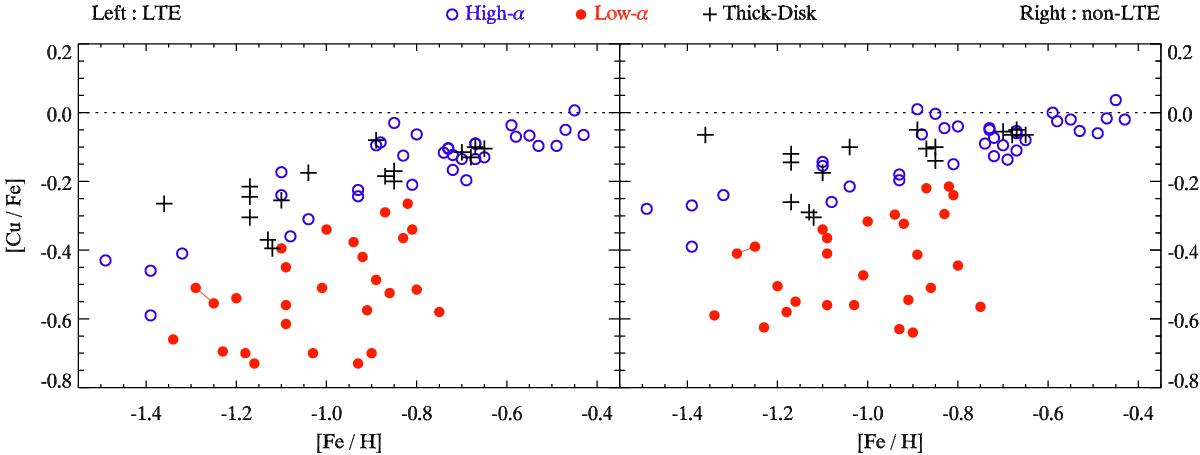
Abundance ratios [Cu/Fe] as a function of [Fe/H] for the program stars, where LTE and non-LTE results are represented in the left and right panel, respectively. The high-α (open blue circles), low-α (filled red circles) and thick-disk populations (black crosses) are indicated (see the online version for color copies of the figures). G112-42 and G112-43 are connected with a straight line.
Current usage metrics show cumulative count of Article Views (full-text article views including HTML views, PDF and ePub downloads, according to the available data) and Abstracts Views on Vision4Press platform.
Data correspond to usage on the plateform after 2015. The current usage metrics is available 48-96 hours after online publication and is updated daily on week days.
Initial download of the metrics may take a while.