Fig. 8
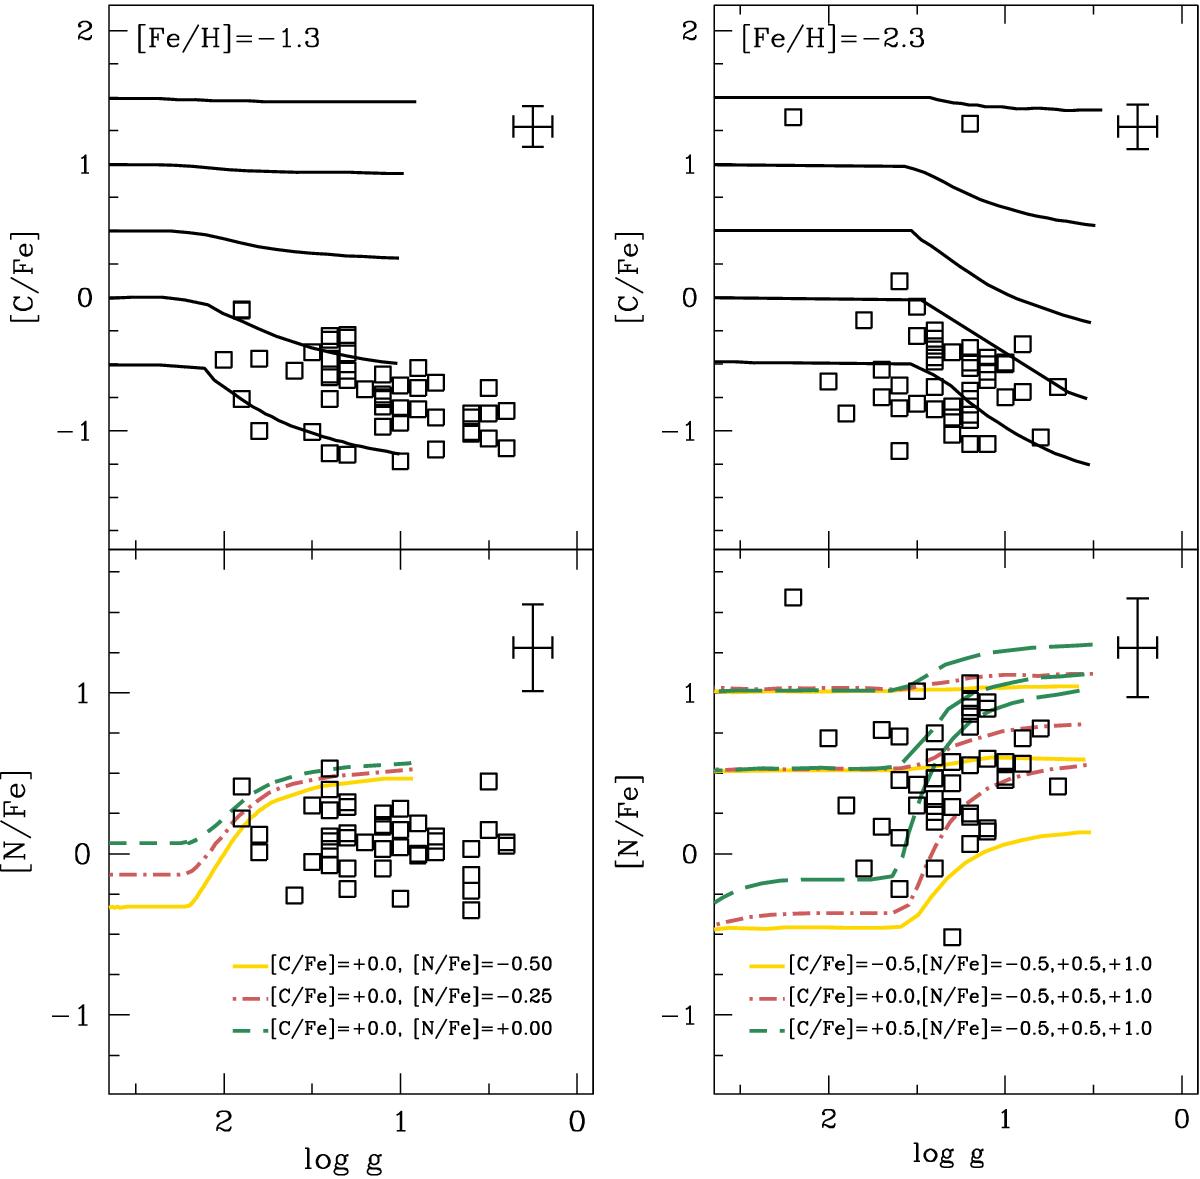
[C/Fe] (top) and [N/Fe] (bottom) abundance ratios for stars with metallicity [ Fe / H ] > −2.0 dex (left-hand panel) and [Fe/H] ≤ –2.0 (right-hand panel) are compared with the theoretical models by Placco et al. (2014) at metallicity [ Fe / H ] = −1.3 and [ Fe / H ] = −2.3 dex. The mean error on the abundances and the photometric gravity is shown in the top right corner of each panel. Black solid lines (top panel only) are the theoretical models for [C/Fe] = 1.5, 1.0, 0.5, 0.0, –0.5 dex assuming [N/Fe] = +0.0. Colored lines (bottom panels only) are the theoretical models for [N/Fe]. The color coding refers to the initial composition of the models; see the keys on the bottom of each plot.
Current usage metrics show cumulative count of Article Views (full-text article views including HTML views, PDF and ePub downloads, according to the available data) and Abstracts Views on Vision4Press platform.
Data correspond to usage on the plateform after 2015. The current usage metrics is available 48-96 hours after online publication and is updated daily on week days.
Initial download of the metrics may take a while.