Fig. 13
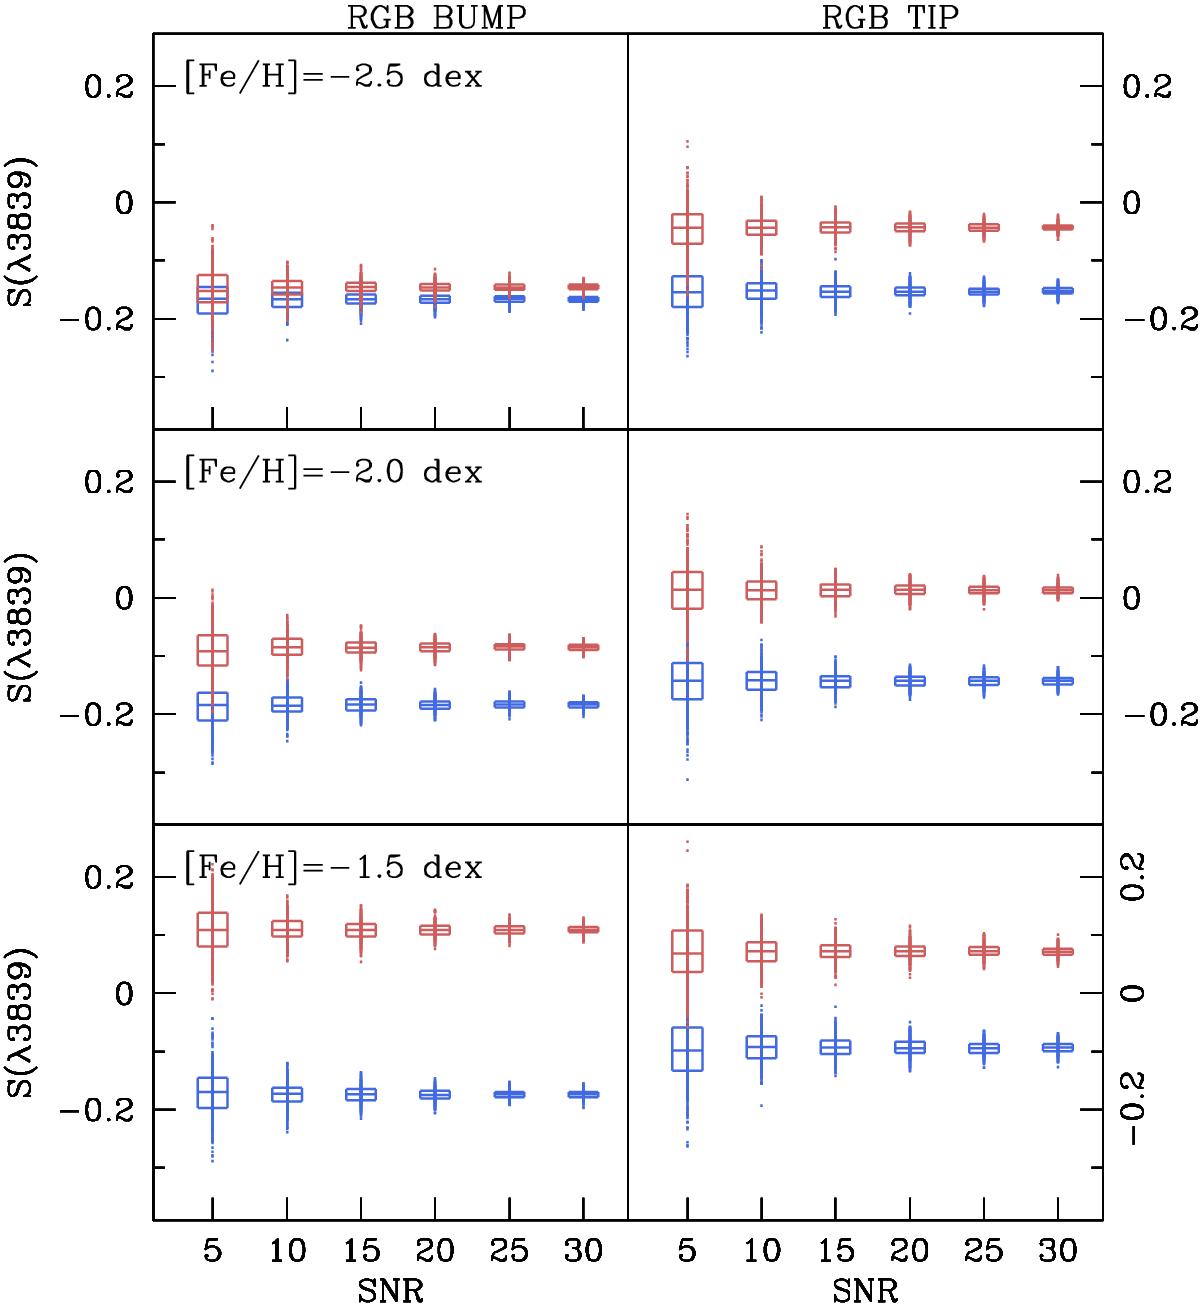
Box and whisker plot of S(λ3839) abundances as a function of the signal-to-noise ratio (per pixel) for a CN-normal (blue) and CN-strong (red) simulated stars. Left-hand panels are the results of template synthetic spectra with typical atmospheric parameters as for RGB bump stars, while right-hand panels indicate a representative star at the tip of the RGB. For each evolutionary stage, we report results for three different metallicities, [ Fe / H ] = −2.5, –2.0, and –1.5 (from top to bottom). For a given S/N, the bottom and top of the box represents the 25% and 75% percentile range, respectively, and the median is indicated by the band inside the box. The vertical tails extending from the boxes indicate the total range of S(λ3839) measurements determined for each S/N.
Current usage metrics show cumulative count of Article Views (full-text article views including HTML views, PDF and ePub downloads, according to the available data) and Abstracts Views on Vision4Press platform.
Data correspond to usage on the plateform after 2015. The current usage metrics is available 48-96 hours after online publication and is updated daily on week days.
Initial download of the metrics may take a while.