Fig. 5
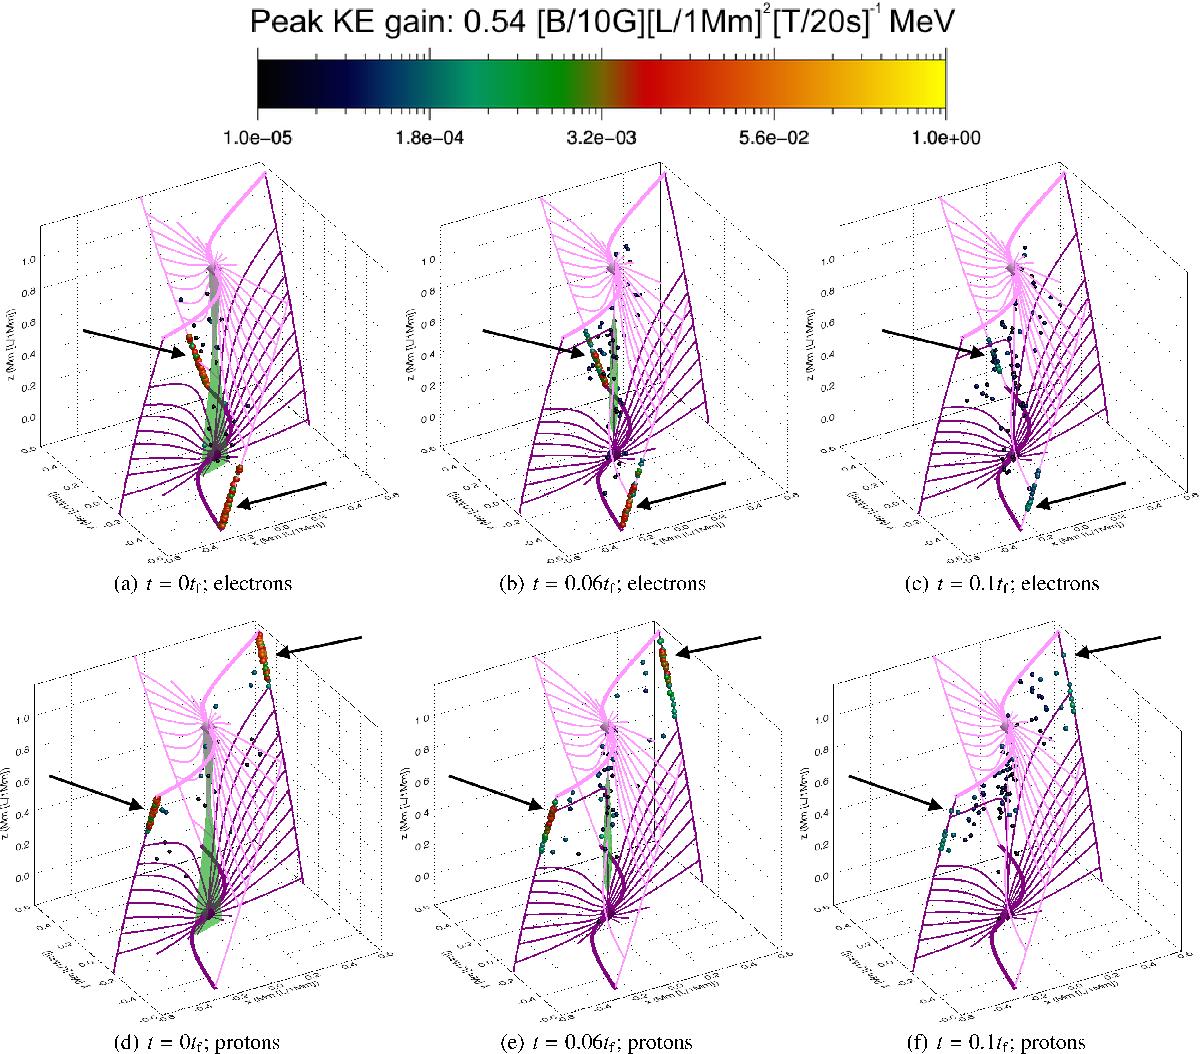
Numerical MHD separator model (MHS2); Final electron and proton positions coloured by particle energy gain, based on different snapshots during the MHD experiment. Each row depicts a different snapshot, for electron (top) and proton (bottom) positions and each is overlaid with the corresponding isosurface of critical current, jcrit (in green) for that snapshot. Black arrows indicate typical final positions of accelerated particles, as a guide; these locations most strongly reflect changes in particle behaviour as experiment evolves. Topological features seen here are coloured in an identical manner to those identified in Fig. 1 and previous experiments. For reference, bscl = 10 G, lscl = 1 Mm, and tscl = 20 s for these orbit simulations.
Current usage metrics show cumulative count of Article Views (full-text article views including HTML views, PDF and ePub downloads, according to the available data) and Abstracts Views on Vision4Press platform.
Data correspond to usage on the plateform after 2015. The current usage metrics is available 48-96 hours after online publication and is updated daily on week days.
Initial download of the metrics may take a while.