Fig. 2
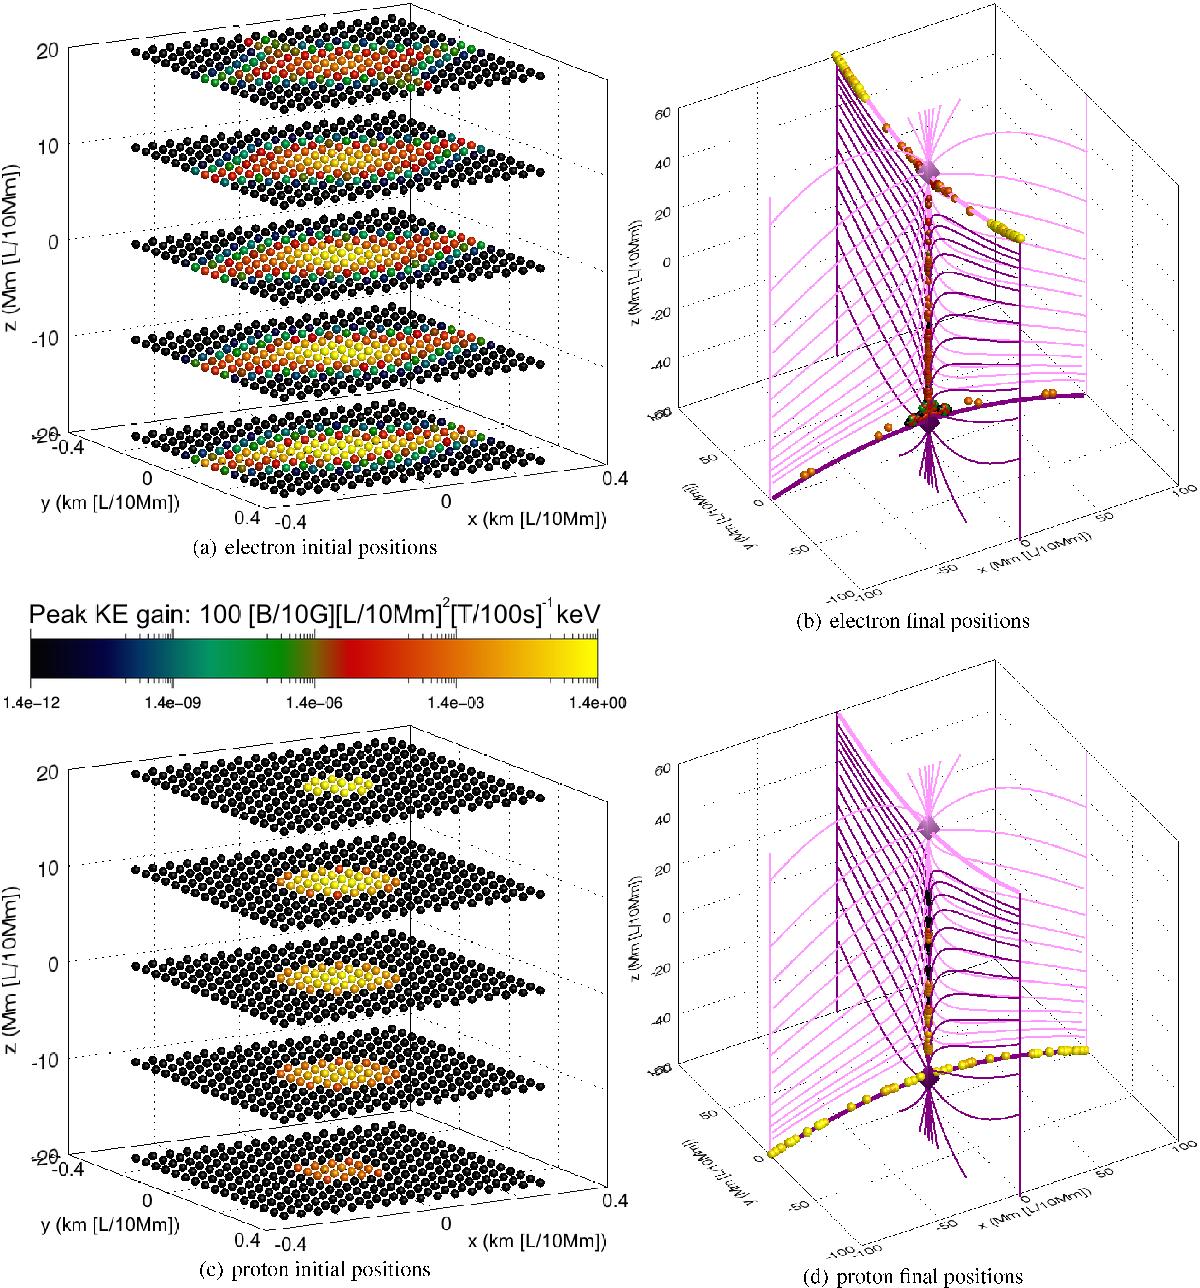
Analytical separator model (Threlfall et al. 2015b); a) initial positions (closeup around separator) and b) final positions for electrons with initial pitch angle 45° and initial kinetic energy of 20 eV. c) and d) are the same, but for protons. The colour of each particle identifies the (scaled) peak kinetic energy gained during each orbit (see colour bar). For b) and d) thin pink/purple lines are field lines in the fan planes associated with the upper/lower nulls (indicated by trapezoids) and thick pink/purple lines indicate the corresponding null’s spine. Also in these graphs, to aid visualisation, the orb size for each particle has been enhanced in proportion to its final energy. For reference, bscl = 10 G, lscl = 10 Mm, and tscl = 100 s for these orbit simulations.
Current usage metrics show cumulative count of Article Views (full-text article views including HTML views, PDF and ePub downloads, according to the available data) and Abstracts Views on Vision4Press platform.
Data correspond to usage on the plateform after 2015. The current usage metrics is available 48-96 hours after online publication and is updated daily on week days.
Initial download of the metrics may take a while.