Fig. 9
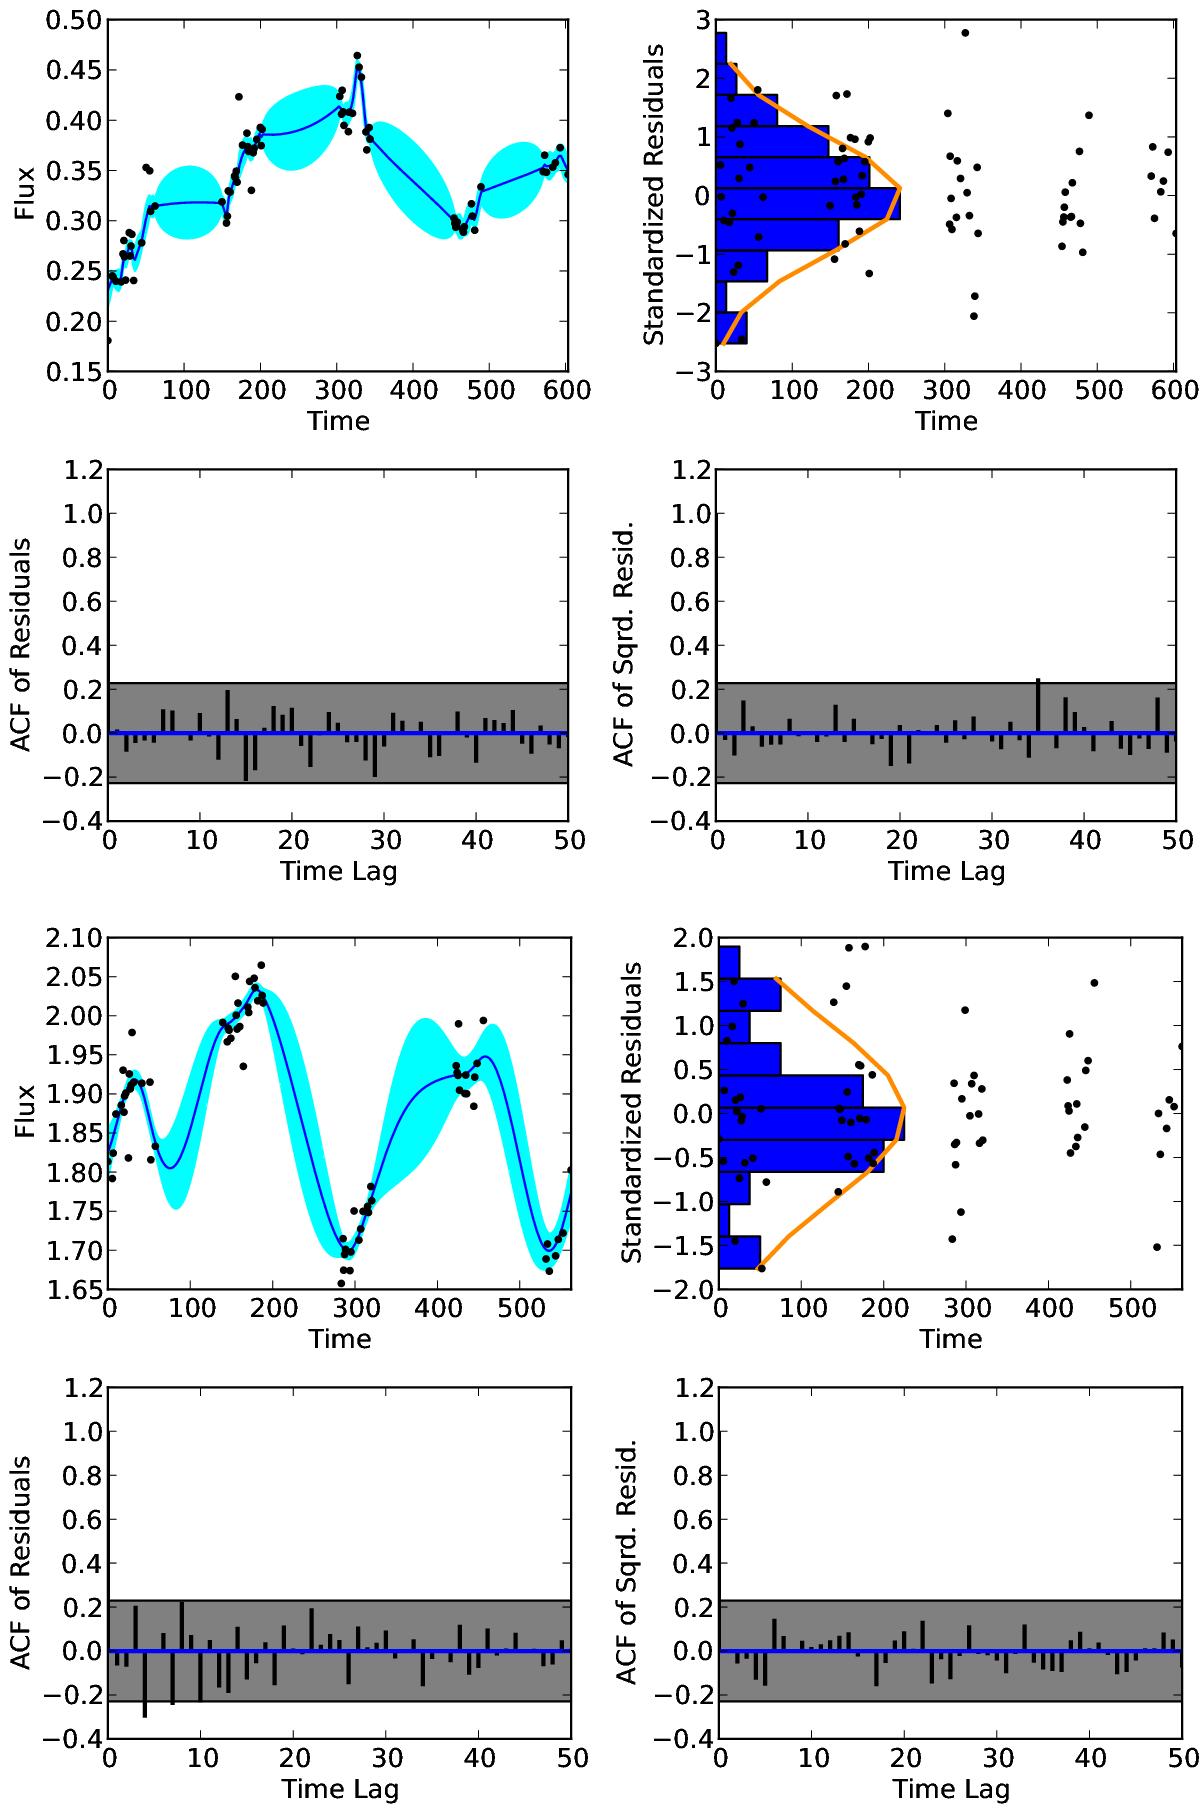
In both subpanels starting from top left: a) gP1 band flux light curve (in units of 3631 Jy times 108) with the solid blue line and cyan regions corresponding to the modeled light curve and 1σ error bands given the measured data (black points). b) Standardized residuals (black points) and their histogram in blue, overplotted with the expected standard normal distribution (orange line). c) and d) autocorrelation functions (ACF) of the standardized residuals (bottom left) and their square (bottom right) with the shaded region displaying the 95% confidence intervals assuming a white noise process. The top four panels show the data of the AGN with XID 2391 that is best fit by a CARMA(3,0) process. The bottom four panels show data of the AGN with XID 30 that is best fit by a CARMA(2,0) process.
Current usage metrics show cumulative count of Article Views (full-text article views including HTML views, PDF and ePub downloads, according to the available data) and Abstracts Views on Vision4Press platform.
Data correspond to usage on the plateform after 2015. The current usage metrics is available 48-96 hours after online publication and is updated daily on week days.
Initial download of the metrics may take a while.