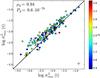
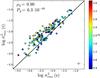
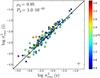
Fig. 3
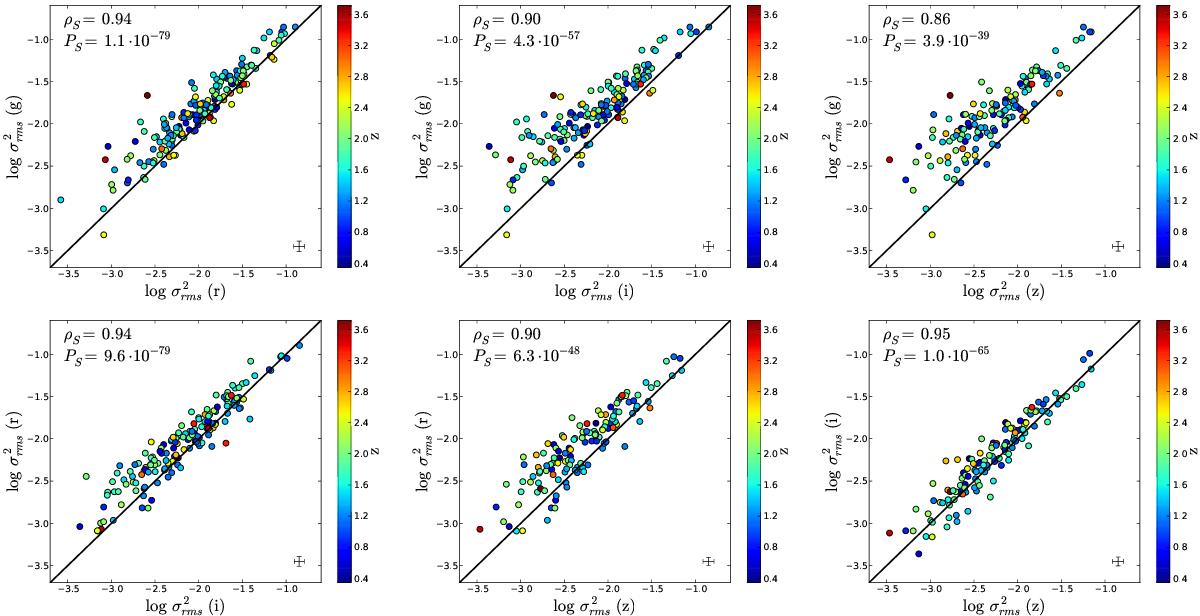
Comparing the excess variance measured on timescales of years in the different PS1 bands. The data of all objects from the total sample with variability information in both considered bands are shown. The Spearman correlation coefficient and the respective p-value are reported in each subpanel. The redshift is given as a color bar. The black line corresponds to the one-to-one relation. The black error bars are the average values.
Current usage metrics show cumulative count of Article Views (full-text article views including HTML views, PDF and ePub downloads, according to the available data) and Abstracts Views on Vision4Press platform.
Data correspond to usage on the plateform after 2015. The current usage metrics is available 48-96 hours after online publication and is updated daily on week days.
Initial download of the metrics may take a while.