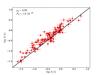
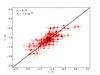
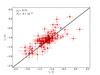
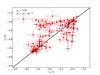
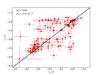
Fig. B.1
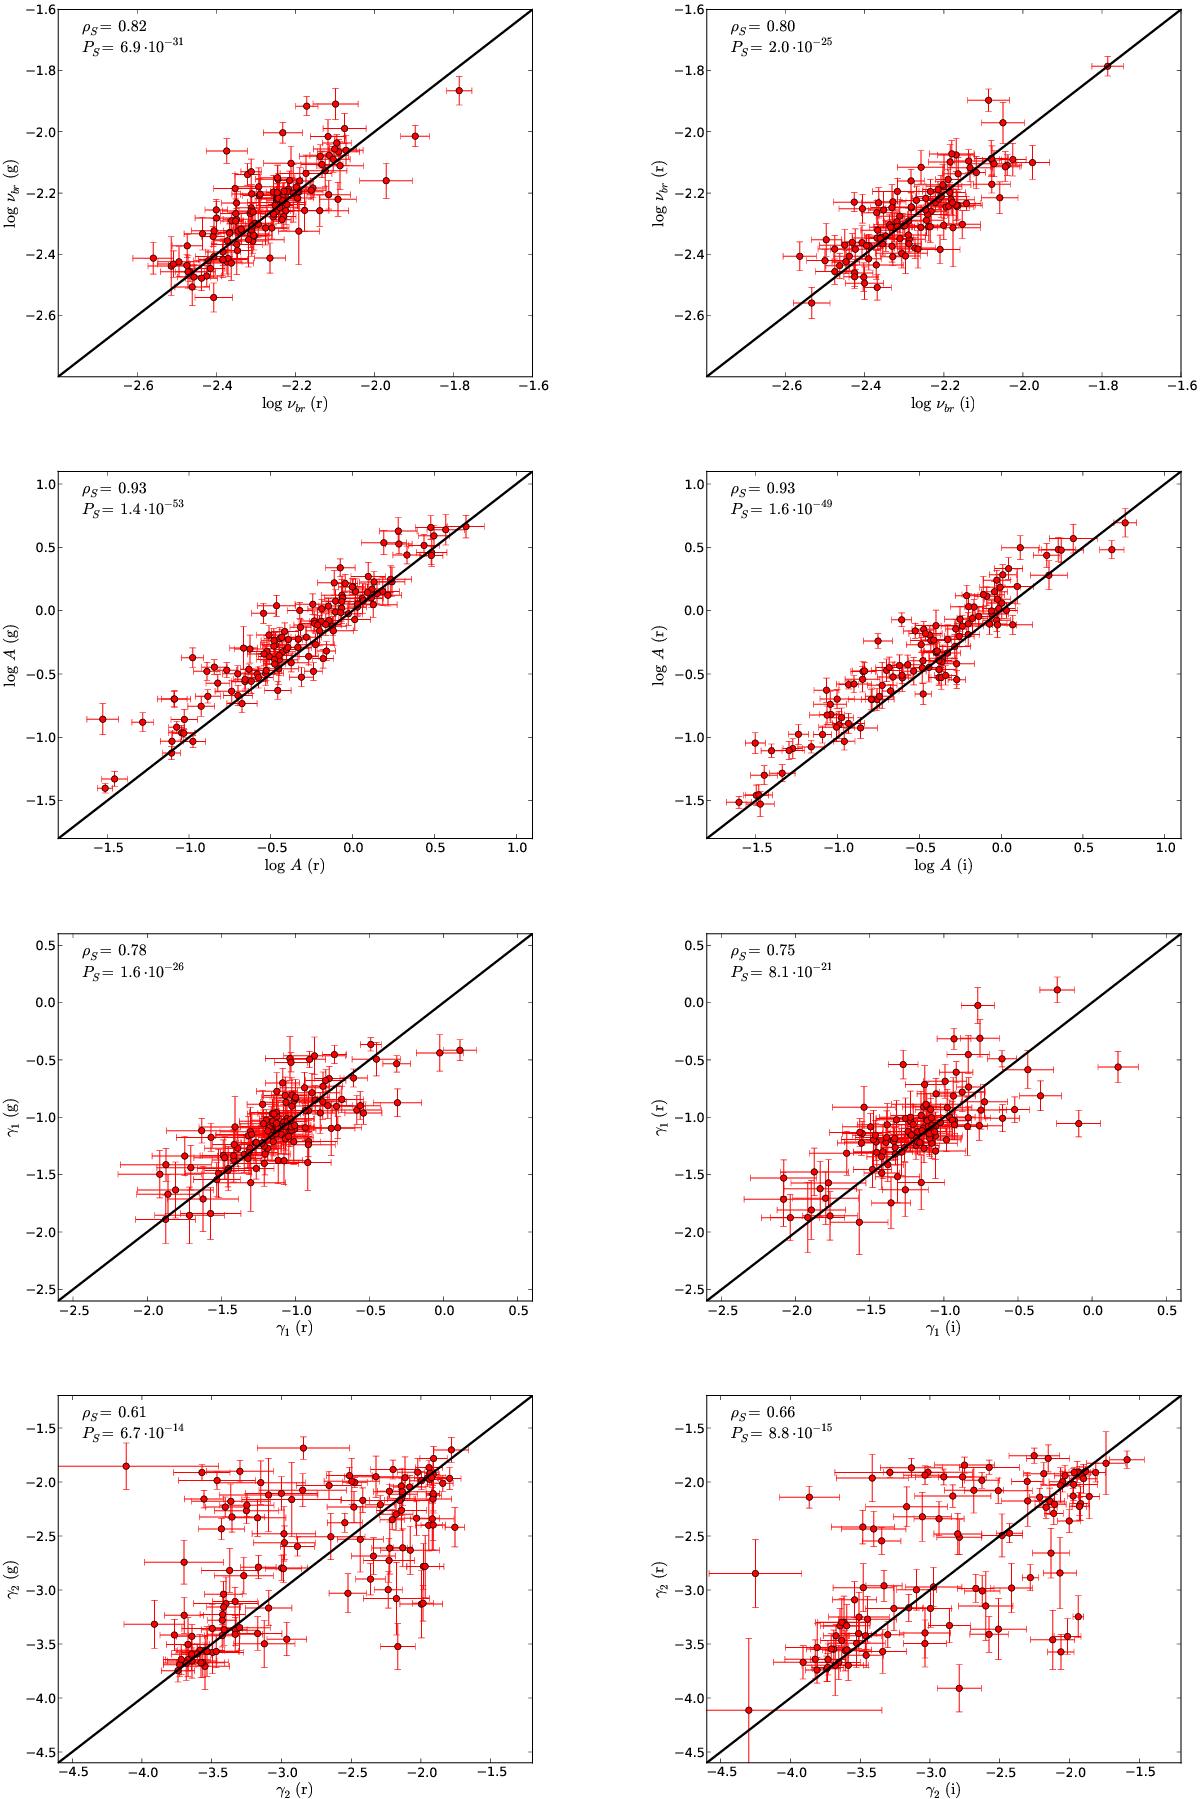
Comparison of the fit parameters of the broken power law PSD (Eq. (12)) in various PS1 bands. The data of all objects from the PSD sample with fit parameters in both considered bands are shown. The black line corresponds to the one-to-one relation. The Spearman correlation coefficient and respective p-value are shown in each panel.
Current usage metrics show cumulative count of Article Views (full-text article views including HTML views, PDF and ePub downloads, according to the available data) and Abstracts Views on Vision4Press platform.
Data correspond to usage on the plateform after 2015. The current usage metrics is available 48-96 hours after online publication and is updated daily on week days.
Initial download of the metrics may take a while.