Free Access
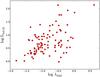
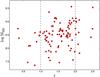
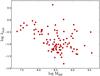
Fig. A.1
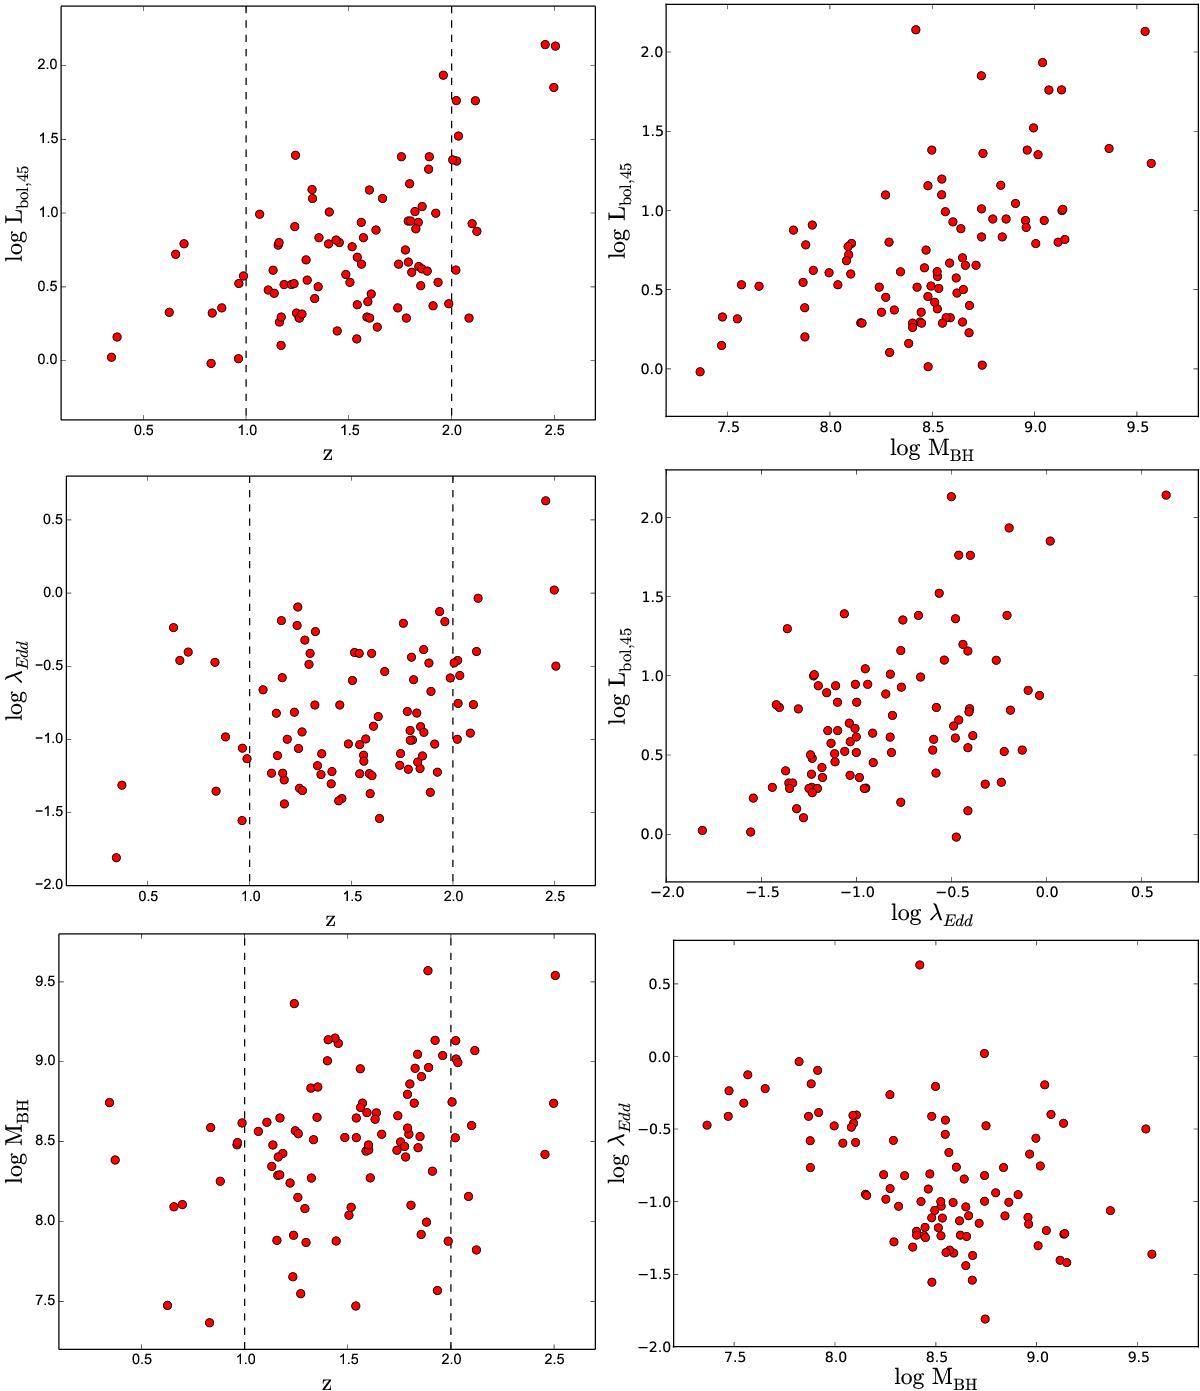
Dependence of the quantities Lbol, λEdd and MBH on redshift (left column) and scalings between the physical quantities (right column). The object data of the gP1 band MBH sample are shown. The dashed vertical lines in the left column enclose the sources of the 1z2_MBH sample.
This figure is made of several images, please see below:
Current usage metrics show cumulative count of Article Views (full-text article views including HTML views, PDF and ePub downloads, according to the available data) and Abstracts Views on Vision4Press platform.
Data correspond to usage on the plateform after 2015. The current usage metrics is available 48-96 hours after online publication and is updated daily on week days.
Initial download of the metrics may take a while.