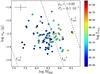
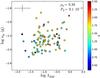
Fig. 14

Optical break frequency (gP1 band PSD_MBH sample) versus MBH, color coded with Lbol (top) and λEdd, color coded with redshift (bottom). The black error bars are the average values. There is no significant evidence for a correlation with these AGN parameters. The dashed lines in the top panel correspond to the expected scaling of the orbital, thermal and viscous timescales at 10RS, see text for details.
Current usage metrics show cumulative count of Article Views (full-text article views including HTML views, PDF and ePub downloads, according to the available data) and Abstracts Views on Vision4Press platform.
Data correspond to usage on the plateform after 2015. The current usage metrics is available 48-96 hours after online publication and is updated daily on week days.
Initial download of the metrics may take a while.