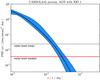
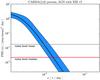
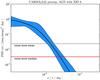
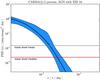
Fig. 10
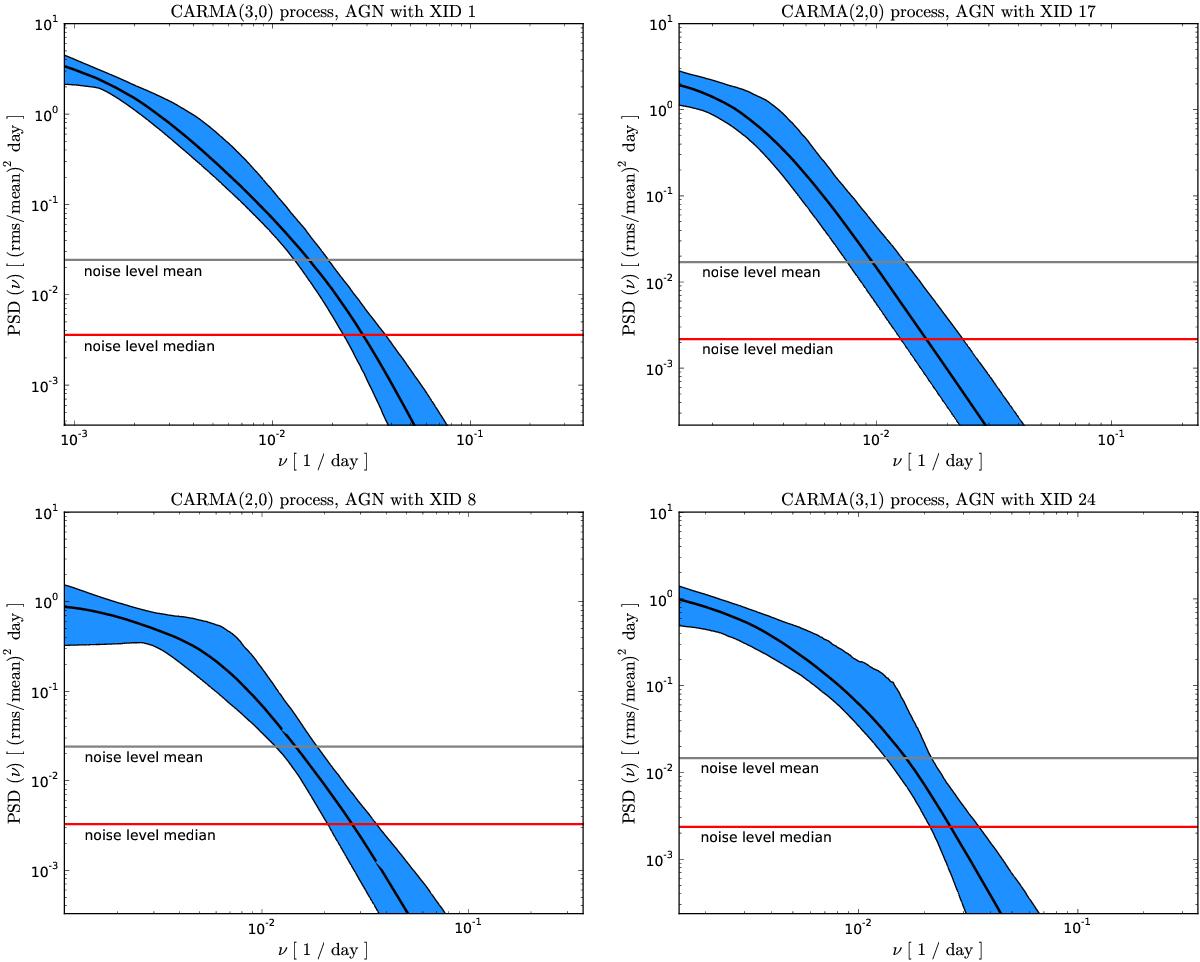
Power spectral densities derived from CARMA model fits to the gP1 band flux light curves for four AGNs of our sample. The solid black line corresponds to the maximum-likelihood estimate of the PSD assuming the chosen CARMA model (selected by minimizing the AICc), the blue region shows the 95% confidence interval. The horizontal lines denote the approximate measurement noise level of the data, estimated by ![]() (gray line) and
(gray line) and ![]() (red line).
(red line).
Current usage metrics show cumulative count of Article Views (full-text article views including HTML views, PDF and ePub downloads, according to the available data) and Abstracts Views on Vision4Press platform.
Data correspond to usage on the plateform after 2015. The current usage metrics is available 48-96 hours after online publication and is updated daily on week days.
Initial download of the metrics may take a while.