Free Access
Fig. 1
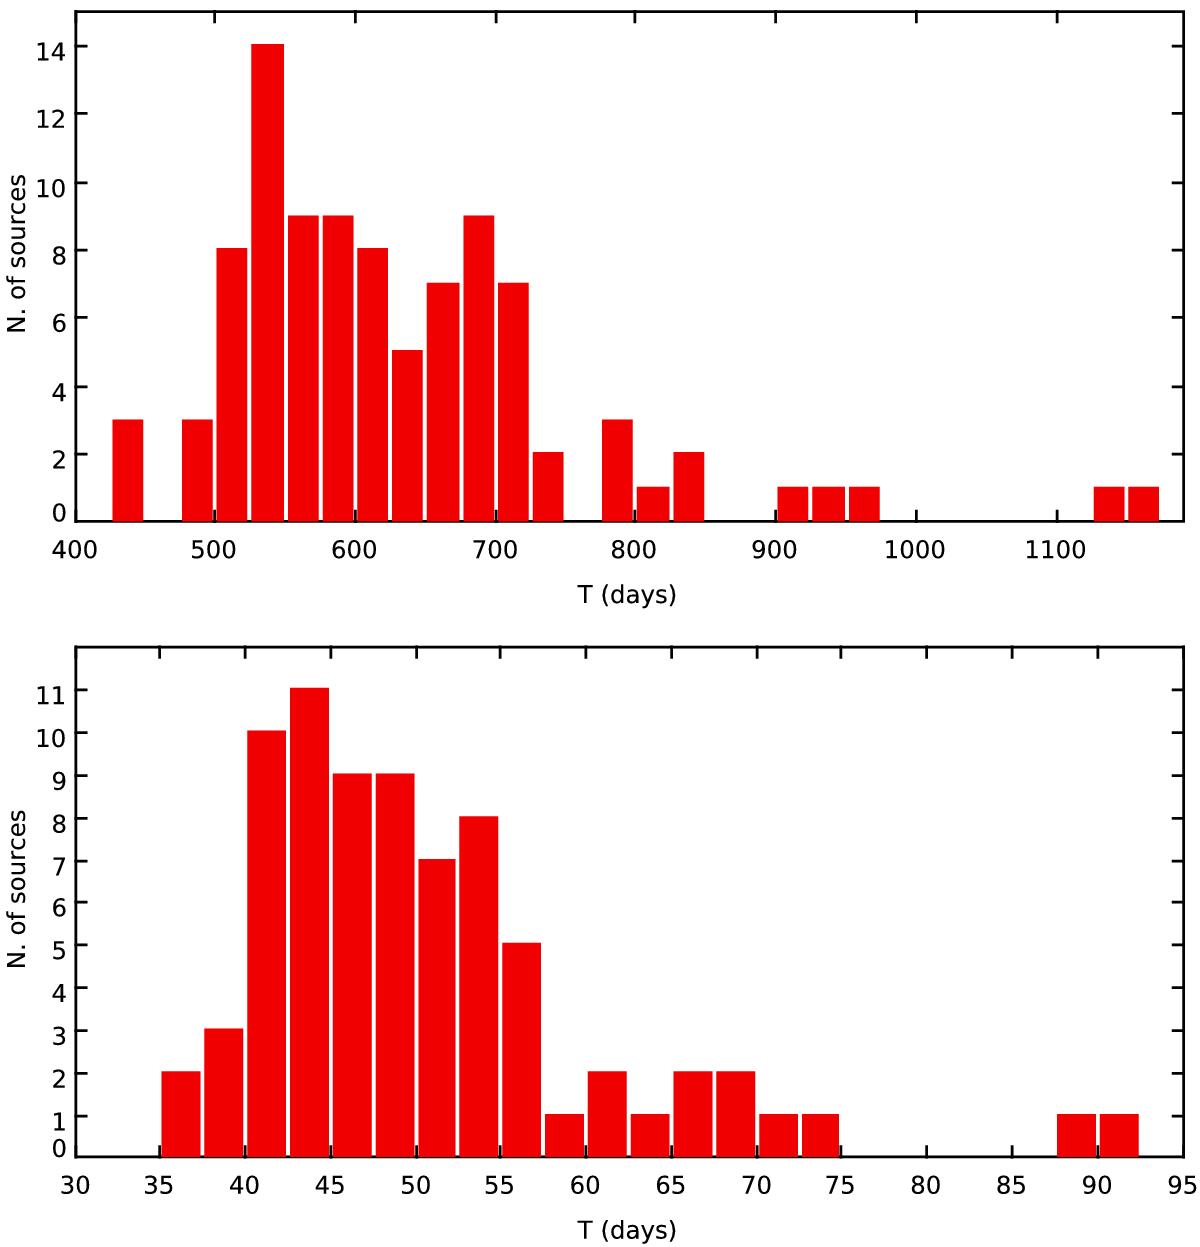
Top panel: histogram of the rest-frame observation length of the total light curve for the year timescale MBH sample (gP1 band). Bottom panel: histogram of the rest-frame observation length (average value of the light-curve segments) for the month timescale MBH sample (gP1 band).
This figure is made of several images, please see below:
Current usage metrics show cumulative count of Article Views (full-text article views including HTML views, PDF and ePub downloads, according to the available data) and Abstracts Views on Vision4Press platform.
Data correspond to usage on the plateform after 2015. The current usage metrics is available 48-96 hours after online publication and is updated daily on week days.
Initial download of the metrics may take a while.