| Issue |
A&A
Volume 585, January 2016
|
|
|---|---|---|
| Article Number | A7 | |
| Number of page(s) | 7 | |
| Section | Stellar structure and evolution | |
| DOI | https://doi.org/10.1051/0004-6361/201527044 | |
| Published online | 08 December 2015 | |
Single stars in the Hyades open cluster
Fiducial sequence for testing stellar and atmospheric models⋆,⋆⋆
1 Max-Planck-Institut für Astronomie, Königstuhl 17, 69117 Heidelberg, Germany
e-mail: This email address is being protected from spambots. You need JavaScript enabled to view it.
2 International Max-Planck Research School for Astronomy and Cosmic Physics at the University of Heidelberg, IMPRS-HD, Germany
3 University of Roma Tor Vergata, Department of Physics, via della Ricerca Scientifica 1, 00133 Roma, Italy
4 INFN, Section of Pisa, Largo Bruno Pontecorvo 3, 56127 Pisa, Italy
5 University of Pisa, Department of Physics ’E.Fermi’, Largo Bruno Pontecorvo 3, 56127 Pisa, Italy
6 Department of Astronomy, University of Florida, 211 Bryant Space Science Center, Gainesville, FL 32611, USA
7 Astronomisches Rechen-Institut, Zentrum für Astronomie der Universität Heidelberg, Mönchhofstr. 12-14, 69120 Heidelberg, Germany
Received: 23 July 2015
Accepted: 31 August 2015
Abstract
Context. Age and mass determinations for isolated stellar objects remain model-dependent. While stellar interior and atmospheric theoretical models are rapidly evolving, we need a powerful tool to test them. Open clusters are good candidates for this role.
Aims. We aim to create a fiducial sequence of stellar objects for testing stellar and atmospheric models.
Methods. We complement previous studies on the Hyades multiplicity by Lucky Imaging observations with the AstraLux Norte camera. This allows us to exclude possible binary and multiple systems with companions outside a 2–7 AU separation and to create a single-star sequence for the Hyades. The sequence encompasses 250 main-sequence stars ranging from A5V to M6V. Using the Tool for Astrophysical Data Analysis (TA-DA), we create various theoretical isochrones applying different combinations of interior and atmospheric models. We compare the isochrones with the observed Hyades single-star sequence on J vs. J−Ks, J vs. J−H, and Ks vs. H−Ks color–magnitude diagrams. As a reference we also compute absolute fluxes and magnitudes for all stars from X-ray to mid-infrared based on photometric measurements available in the literature(ROSAT X-ray, GALEX UV, APASS gri, 2MASS JHKs, and WISE W1 to W4).
Results. We find that combinations of both PISA and DARTMOUTH stellar interior models with BT-Settl 2010 atmospheric models describe the observed sequence well. We use PISA in combination with BT-Settl 2010 models to derive theoretical predictions for physical parameters (Teff, mass, log g) of 250 single stars in the Hyades. The full sequence covers the mass range of 0.13–2.30 M⊙, and effective temperatures between 3060 K and 8200 K.
Conclusions. Within the measurement uncertainties, the current generation of models agree well with the single-star sequence. The primary limitations are the uncertainties in the measurement of the distances to individual Hyades members, and uncertainties in the photometry. Gaia parallaxes, photometry, and spectroscopy will greatly reduce the uncertainties in particular at the lowest mass range, and will enable us to test model predictions with greater confidence. Additionally, a small (~0.05 mag) systematic offset can be noted in J vs. J−K and K vs. H−K diagrams – the observed sequence is shifted to redder colors than the theoretical predictions.
Key words: stars: general / open clusters and associations: individual: the Hyades / stars: fundamental parameters / stars: atmospheres / binaries: general / techniques: high angular resolution
Based on observations collected at the Centro Astronómico Hispano Alemán (CAHA) at Calar Alto, operated jointly by the Max-Planck Institut für Astronomie and the Instituto de Astrofísica de Andalucía (CSIC).
Full Table 2 is only available at the CDS via anonymous ftp to cdsarc.u-strasbg.fr (130.79.128.5) or via http://cdsarc.u-strasbg.fr/viz-bin/qcat?J/A+A/585/A7
© ESO, 2015
1. Introduction
The knowledge of physical parameters of stellar and substellar objects provides the basis for astrophysics. Observations allow us to determine distance (using parallaxes), age (through membership in clusters or moving groups), mass (by calculating orbital parameters in binary systems), and radius (in transiting and eclipsing systems). Asteroseismic scaling relations can also provide estimates for stellar mass and radius. However, these relations may suffer from unknown systematic effects and may require additional calibration using observations and theoretical models (e.g. Miglio et al. 2012). Therefore, when dealing with isolated stellar objects, we usually have to rely on theoretical models to determine mass and age. While stellar and atmospheric models are rapidly evolving, we need a powerful tool to test and calibrate them. Open clusters are good candidates for this role, since they contain many coeval objects of the same chemical composition spanning a range of masses, thus avoiding the problems of small number statistics. Additionally, open clusters have distance and age estimates that are independent of theoretical models to be tested.
Characteristics of various multiplicity surveys in the Hyades.
In general, the validation of theoretical models consists of two independent problems – one is testing interior structures of stars, the other is inspecting atmospheric models. However, this process is non-trivial because models of the interior structure provide us with physical parameters (e.g., effective temperature, luminosity, mass, and age) that need to be converted into observed quantities (magnitudes, colors, and fluxes). This conversion exploits grids of synthetic spectra provided by atmospheric models and requires careful calibration for specific photometric bands (e.g. Da Rio & Robberto 2012).
In the past, open clusters had already been used as benchmarks for theoretical models. Bell et al. (2012) used the Pleiades to test existing pre-main-sequence isochrones by comparing their predictions with well-calibrated color–magnitude diagrams in the wavelength range of 0.4–2.5 μm. Bell et al. have shown that no pre-main-sequence model can describe the observed Pleiades sequence for the temperatures cooler than 4000 K. The predicted fluxes are overestimated by a factor of 2 at 0.5 μm, with the difference decreasing with increasing wavelength.
In comparison to the Pleiades (d ~ 120–140 pc; Percival et al. 2005; van Leeuwen 2009), the Hyades open cluster is closer to the Sun (d ~ 45 pc; Perryman et al. 1998; van Leeuwen 2009). This allows us to resolve companions with smaller physical separations, and also to analyze less luminous, hence less massive, objects. Moreover, Röser et al. (2011) reported 724 likely members of the Hyades, with individual kinematic distance estimates using the convergent point method (e.g. van Leeuwen 2009). Individual distance measurements allow us to get more precise absolute magnitudes for each member of the Hyades. The previous attempt to test stellar models with the Hyades (Castellani et al. 2001) showed a discrepancy between theoretical predictions and the observed main-sequence sample, especially at the region of the coolest stars.
In this paper, we present a fiducial single-star sequence in the Hyades based on literature data and our own AstraLux Lucky Imaging observations. Furthermore, we use the obtained sequence to provide a test for commonly used stellar and atmospheric models. The paper is organized as follows: Sect. 2 describes observations and data from the literature; Sect. 3 discusses the theoretical models used; in Sect. 4 we show the single-star sequence in the Hyades compared to theoretical isochrones calculated using various stellar, and atmospheric models and determine physical parameters of each Hyades single star; in Sect. 5 we discuss our results and give a brief summary.
2. Observations and literature data
To test interior and atmospheric models we use JHKs 2MASS data (Skrutskie et al. 2006), which provides a homogenous photometric set for all the 724 possible members of the Hyades. The angular resolution of 2MASS is limited to ~ 3″. To avoid a scatter on color–magnitude diagrams that can be introduced by unresolved binary and multiple systems, or optical blends with unrelated field or background stars, we check the literature and archived databases for multiplicity and perform Lucky Imaging observations. The saturation threshold of the 2MASS photometry is Ks ~ 4 mag; therefore, fluxes for the brightest stars are replaced by the data from Carney (1982), with a transformation to the 2MASS system applied. The color uncertainties are calculated in the standard way exploiting independent photometric magnitude uncertainties estimates.
2.1. Literature data
We check previous studies that make an attempt to identify binary and multiple systems in the Hyades including works of Patience et al. (1998), Mermilliod et al. (2009), Morzinski (2011), and Duchêne et al. (2013) and archival data from Hipparcos, Hubble Space Telescope (HST), and Washington Double Star (WDS; Mason et al. 2001) catalogs. The HST data have also been previously studied by Gizis & Reid (1995), Reid & Gizis (1997), and Reid & Mahoney (2000). Characteristics of the surveys are summarized in Table 1.
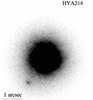 |
Fig. 1 AstraLux Norte z′-band image of a binary candidate in the Hyades. The image is shown in log scale. |
2.2. AstraLux Lucky imaging observations
The Lucky Imaging technique is based on a series of short (few to several 10 ms) exposures, which “freeze” the speckle clouds caused by atmospheric turbulence. The series of frames is sorted by the best quality (based on the brightest pixel), and typically the best 1% to 10% of the images are shifted and co-added, resulting in a close to diffraction limited image. AstraLux Norte is a lucky imaging camera mounted on the 2.2 m telescope at the Calar Alto observatory in Spain (Hormuth et al. 2008). The camera has a field of view (FOV) of 24″ × 24″ and a pixel scale of ~47 mas/px.
The observations were performed in November 2011, and November and December 2012. Depending on the brightness of the target and observing conditions, either a 15 or 30 ms exposure time was chosen, so that 20 000 or 10 000 short exposures were obtained for each target, respectively. Only one quadrant of the detector was read-out to facilitate shorter integration times.
The Hyades targets for the AstraLux run are pre-selected based on the results of the literature and archive check. In total 198 Hyades members are observed in SDSS i′ and z′ filters. The analysis for each target is performed based on the best 1% frames that are co-added together. Possible companions are identified by a visual check of each co-added frame (see Fig. 1) resulting in 40 Hyades members that reveal one or several companion candidates. Twenty-eight of the 40 systems with companion candidates did not have any binary/multiplicity record in previously published surveys. Most of the AstraLux candidates to binary and multiple systems have only one epoch of observations, therefore they cannot be confirmed as common proper motion companions. Non-detections exclude companions outside a projected separation of 3–7 AU (depending on the distance to a star), though these stars could still have unresolved companions closer in.
In total 463 Hyades members are observed in one or more surveys and 213 of them are identified as candidates for binary or multiple systems leading to 250 stars that do not have identified companions outside projected separation of 2–7 AU (depending on survey and distance to the star). Importantly, the angular resolution of instruments in the surveys we use varies from 0 05 to 011, which, in addition to various stars’ distances, gives a range of separation where companions can be detected (2–7 AU; see Table 2). Hence, this means different detection thresholds for companions depending on the survey(s) in which the system was observed. Since this complicates the statistical analysis for constraining the number of binary and multiple systems, a robust estimate of the multiplicity properties of the Hyades will be a subject of a separate paper.
Absolute JHKs(2MASS) photometry and physical parameters of the Hyades single-star sequence members.
3. Models
In this section we describe the stellar evolutionary models and synthetic spectra used to produce theoretical isochrones for the Hyades and compare them with the observed single-star sequence.
3.1. Interior models
We use two different stellar interior models – DARTMOUTH and the new PISA grids produced for the Hyades case. More recently, new BHAC15 (Baraffe et al. 2015) stellar models have been published. These models follow the widely used BCAH98 models (Baraffe et al. 1998). However, BHAC15 models do not provide interior structures for super-solar metallicities yet, therefore, we do not use them for isochrone comparison.
The Dartmouth Stellar Evolution Program (DSEP; Dotter et al. 2008) is a family of stellar evolutionary models exploring a wide range of metallicities and α-enhancements. The basic equation of state for tracks M ≥ 0.8 M⊙ is a general ideal gas EOS with a Debye-Hückel correction (Chaboyer & Kim 1995). The FreeEOS in the EOS4 configuration is used for the lower mass tracks. Evolutionary tracks are computed for masses from 0.1 to 4 M⊙. We use isochrones for [Fe/H] = 0.14 and [α/H] = 0.0. For the Hyades metallicity, the DSEP models include a convective core overshooting parameter of 0.2 times the pressure scale height for M ≥ 1.1 M⊙.
The new PISA models have been computed by means of the FRANEC stellar evolutionary code (Degl’Innocenti et al. 2008), adopting input physics similar to the parameters already discussed in Tognelli et al. (2011) and Dell’Omodarme et al. (2012). The main difference with respect to the models already available at the Pisa database page1 is the adoption of the SCVH95 EOS for the computation of stellar models with mass lower than 0.2 M⊙. We adopt the recent Asplund et al. (2009) solar metal distribution, and the corresponding mixing length parameter calibrated on the Sun, namely αML = 1.74. We also include a mild convective core overshooting (βov = 0.2) for M ≥ 1.2M⊙ (Tognelli et al. 2012). The models have been computed in the mass range [0.1, 2.8] M⊙ from the early pre-MS evolution up to the exhaustion of the central hydrogen. The corresponding isochrones in the age interval [400, 800] Myr, with an age spacing of 10 Myr, have been generated. The stellar models have been computed for [Fe/H] = + 0.14, which – adopting the Asplund et al.(Z/X)⊙ = 0.0181 and ΔY/ ΔZ = 2 (Casagrande 2007) – corresponds to Y = 0.283 and Z = 0.0175.
To obtain a consistent set of magnitudes for both the Dartmouth and Pisa models, we transform the theoretical isochrones from the (log Teff, log L/L⊙) plane into the color–magnitude diagram by means of our own calculation of the photometric band. To do this we use synthetic spectra obtained from detailed atmospheric models following the method described in Sect. 3.3.
3.2. Atmospheric models
To calculate synthetic photometry we use synthetic spectra provided by BT-Settl atmospheric models (Allard et al. 2013). The BT-Settl models take into account gravitational dust settling in atmospheres of objects at temperatures below ~2600 K, following the approach described in Rossow (1978). Opacities are introduced line by line to account for the effect of molecular absorbers, as described in Allard et al. (2003). The synthetic spectra are calculated using the radiative transfer model atmosphere code PHOENIX that implements static and radial (1D) approximations (Allard et al. 2001). We apply the latest publicly available release of BT-Settl (last update in March 2015) that uses the Caffau et al. (2011) solar abundances. For effective temperatures Teff< 7000 K we use the BT-Settl 2010 version, which exploits the solar abundances of Asplund et al. (2009).
3.3. Synthetic photometry with TA-DA
The Tool for Astrophysical Data Analysis (TA-DA; Da Rio & Robberto 2012) is an interactive software that allows stellar photometric data to be analyzed in comparison with theoretical models and stellar parameters to be derived using multi-band photometry. TA-DA is able to interpolate stellar interior models and to produce synthetic photometry by converting stellar parameters into photometric magnitudes in given filters using grids of synthetic spectra. The conversion is done in the standard way, by integrating the synthetic spectra over the filter bandwidths and normalizing onto a spectrum of Vega. Therefore, TA-DA is very suitable for combining various stellar interior and atmospheric models to derive photometric magnitudes for different evolutionary tracks and isochrones. We use stellar interior models and synthetic spectra from grids of atmospheric models to obtain various isochrones for the Hyades with TA-DA.
4. Hyades single-star sequence
In this section, we give the Hyades single-star sequence as an example to test the theoretical models. Additionally, we determine stellar parameters of the sequence members by comparing photometric observations to the calculated model isochrones. Absolute JHKs magnitudes for the stars on the single-star sequences (see Table 2) are derived from the distance estimates in Röser et al. (2011) and the available near-infrared (NIR) photometry. For all stars we assume the NIR foreground extinction to be negligible.
4.1. Isochrone comparison
We compute theoretical isochrones for combinations of BT-Settl 2010 atmospheric models with PISA and DARTMOUTH interior models for the age of 630 Myr, which is close to the 625 ± 50 Myr estimate of Perryman et al. (1998). We place the obtained isochrones on J vs. J−Ks, J vs. J−H, and Ks vs. H−Ks color–magnitude diagrams together with the observed single-star sequence of the Hyades. As can be seen, PISA and DARTMOUTH tracks both predict the observed sequence reasonably well, even the behavior of the “knee-shaped” part, around ~0.6 M⊙ which was problematic as was previously shown by Röser et al. (2011) for older generation evolutionary models. The PISA models are available with (β = 0.2) and without convective core overshooting. Both sets of models are in good agreement with the presented data, the only difference being the inferred cluster age. As expected, the inclusion of convective core overshooting leads to older ages. Adopting β = 0.2, the best fitting isochrone provides an age of 630 Myr, whereas isochrones without core overshooting give 550 Myr.
The observed sequence reveals a larger scatter towards lower masses, because the faintness of the objects causes larger errors in the photometric and kinematic measurements. Additionally, a small (~0.05 mag) systematic offset can be noted in the J vs. J−Ks and Ks vs. H−Ks diagrams – the observed sequence shifted to redder colors than the theoretical predictions.
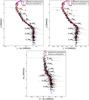 |
Fig. 2 J vs. J−Ks (top left panel), J vs. J−H (top right panel) and Ks vs. H−Ks (bottom right panel) color–magnitude diagrams. The Hyades observed single-star sequence is overplotted with theoretical isochrones (630 Myr) from different evolutionary models – PISA (dashed blue line) and DARTMOUTH (solid red line). Synthetic photometry for isochrones are calculated in TA-DA using BT-Settl 2010 synthetic spectra. |
4.2. Physical parameters of single stars with TA-DA
TA-DA (see Sect. 3.3) includes an option that gives theoretical predictions for stellar parameters based on a comparison of synthetic photometry with observed photometric magnitudes. The dimension of the observational space (number of colors or magnitudes) must be greater than or equal to the number of free parameters given by stellar interior models. The TA-DA parameter filter is described in Da Rio & Robberto (2012) and performs a multiband least-square fit. TA-DA also allows the estimation uncertainties for derived stellar parameters using a Monte Carlo simulation, in which the photometry is displaced according to photometric errors.
Using TA-DA we derive theoretical stellar parameters for 250 members of the Hyades single-star sequence (see Table 2) using BT-Settl2010+PISA isochrones for [Fe/H] = +0.14.
4.3. Spectral energy distribution from X-ray to mid-infrared
For all stars in the single star sequence, we compiled the available literature data from X-rays to mid-infrared ROSAT X-ray (Stern et al. 1995), GALEX UV (Martin & GALEX Team 2005), APASS gri (Henden et al. 2015), 2MASS JHKs, and WISE W1 to W4, and computed absolute fluxes and magnitudes based on the parallaxes from Röser et al. (2011). The values are provided in the full Table 2 available at the CDS.
5. Summary and future prospects
Using previously published high angular resolution and spectroscopic studies and our own Lucky Imaging AstraLux Norte observations, we compiled a single-star sequence for the Hyades, which at an average distance of 45 pc is the open cluster closest to the Sun. In total, we identified 250 members of the cluster that do not show signatures of a companion outside the 2–7 AU projected separation (depending on the distance to each individual member and the survey).
Comparison of the near-infrared properties of the single-star sequence with theoretical isochrones based on the PISA and DARTMOUTH stellar interior models and BT-Settl 2010 atmospheric models shows an overall good agreement for the mass range 0.13–2.30 M⊙. The only disagreement between models and observations is that for masses below 0.6 Msun the observed J−Ks and H−Ks colors are systematically redder than the isochrones by 0.05 mag. Despite these differences, the isochrones calculated using the most recent interior and atmospheric models, show a significantly better agreement with observations than isochrones produced by older generation models. The improvement can be particularly seen around 0.6–0.8 M⊙, where new isochrones are able to reproduce the knee-shaped part of the observed sequence.
We also estimate physical parameters (mass, effective temperature, and surface gravity) for the Hyades single-star sequence members based on theoretical predictions of combined PISA interior and BT-Settl 2010 atmospheric models.
The resulting single-star sequence can be used to test various theoretical models and also to select candidates to search for close, previously unresolved binaries using spectroscopy and high-resolution imaging instruments. In the near future, results from the Gaia survey will provide us with kinematic, photometric, and spectroscopic information that will help to reduce the scatter at the lowest mass part of the observed sequence, which will enable us to test theoretical models with stronger confidence.
Acknowledgments
E.S. and S.R. acknowledge support from the Collaborative Research Center “The Milky Way System” (SFB 881, subproject B5) of the German Research Foundation (DFG). This publication makes use of data products from the Two Micron All Sky Survey, which is a joint project of the University of Massachusetts and the Infrared Processing and Analysis Center/California Institute of Technology, funded by the National Aeronautics and Space Administration and the National Science Foundation. This research has made use of the SIMBAD database, operated at CDS, Strasbourg, France. We acknowledge with thanks the variable star observations from the AAVSO International Database contributed by observers worldwide and used in this research. The authors are grateful to Katie Morzinski for comments about her work on the Hyades.
References
- Allard, F., Hauschildt, P. H., Alexander, D. R., Tamanai, A., & Schweitzer, A. 2001, ApJ, 556, 357 [NASA ADS] [CrossRef] [Google Scholar]
- Allard, N. F., Allard, F., Hauschildt, P. H., Kielkopf, J. F., & Machin, L. 2003, A&A, 411, L473 [NASA ADS] [CrossRef] [EDP Sciences] [Google Scholar]
- Allard, F., Homeier, D., & Freytag, B. 2013, Mem. Soc. Astron. It., 84, 1053 [NASA ADS] [Google Scholar]
- Asplund, M., Grevesse, N., Sauval, A. J., & Scott, P. 2009, ARA&A, 47, 481 [NASA ADS] [CrossRef] [Google Scholar]
- Baraffe, I., Chabrier, G., Allard, F., & Hauschildt, P. H. 1998, A&A, 337, 403 [NASA ADS] [Google Scholar]
- Baraffe, I., Homeier, D., Allard, F., & Chabrier, G. 2015, A&A, 577, A42 [NASA ADS] [CrossRef] [EDP Sciences] [Google Scholar]
- Bell, C. P. M., Naylor, T., Mayne, N. J., Jeffries, R. D., & Littlefair, S. P. 2012, MNRAS, 424, 3178 [NASA ADS] [CrossRef] [Google Scholar]
- Caffau, E., Ludwig, H.-G., Steffen, M., Freytag, B., & Bonifacio, P. 2011, Sol. Phys., 268, 255 [NASA ADS] [CrossRef] [Google Scholar]
- Carney, B. W. 1982, AJ, 87, 1527 [NASA ADS] [CrossRef] [Google Scholar]
- Casagrande, L. 2007, in From Stars to Galaxies: Building the Pieces to Build Up the Universe, eds. A. Vallenari, R. Tantalo, L. Portinari, & A. Moretti, ASP Conf. Ser., 374, 71 [Google Scholar]
- Castellani, V., Degl’Innocenti, S., & Prada Moroni, P. G. 2001, MNRAS, 320, 66 [NASA ADS] [CrossRef] [Google Scholar]
- Chaboyer, B., & Kim, Y.-C. 1995, ApJ, 454, 767 [NASA ADS] [CrossRef] [Google Scholar]
- Da Rio, N., & Robberto, M. 2012, AJ, 144, 176 [NASA ADS] [CrossRef] [Google Scholar]
- Degl’Innocenti, S., Prada Moroni, P. G., Marconi, M., & Ruoppo, A. 2008, Ap&SS, 316, 25 [NASA ADS] [CrossRef] [Google Scholar]
- Dell’Omodarme, M., Valle, G., Degl’Innocenti, S., & Prada Moroni, P. G. 2012, A&A, 540, A26 [NASA ADS] [CrossRef] [EDP Sciences] [Google Scholar]
- Dotter, A., Chaboyer, B., Jevremović, D., et al. 2008, ApJS, 178, 89 [NASA ADS] [CrossRef] [Google Scholar]
- Duchêne, G., Bouvier, J., Moraux, E., et al. 2013, A&A, 555, A137 [NASA ADS] [CrossRef] [EDP Sciences] [Google Scholar]
- Gizis, J., & Reid, I. N. 1995, AJ, 110, 1248 [NASA ADS] [CrossRef] [Google Scholar]
- Henden, A. A., Levine, S., Terrell, D., & Welch, D. L. 2015, in AAS Meet. Abstr., 225, 336.16 [Google Scholar]
- Hormuth, F., Hippler, S., Brandner, W., Wagner, K., & Henning, T. 2008, in SPIE Conf. Ser., 7014 [Google Scholar]
- Martin, C., & GALEX Team 2005, in Maps of the Cosmos, eds. M. Colless, L. Staveley-Smith, & R. A. Stathakis, IAU Symp., 216, 221 [Google Scholar]
- Mason, B. D., Wycoff, G. L., Hartkopf, W. I., Douglass, G. G., & Worley, C. E. 2001, AJ, 122, 3466 [Google Scholar]
- Mermilliod, J.-C., Mayor, M., & Udry, S. 2009, A&A, 498, 949 [NASA ADS] [CrossRef] [EDP Sciences] [Google Scholar]
- Miglio, A., Brogaard, K., Stello, D., et al. 2012, MNRAS, 419, 2077 [NASA ADS] [CrossRef] [Google Scholar]
- Morzinski, K. M. 2011, Ph.D. Thesis, University of California, Santa Cruz [Google Scholar]
- Patience, J., Ghez, A. M., Reid, I. N., Weinberger, A. J., & Matthews, K. 1998, AJ, 115, 1972 [NASA ADS] [CrossRef] [Google Scholar]
- Percival, S. M., Salaris, M., & Groenewegen, M. A. T. 2005, A&A, 429, 887 [NASA ADS] [CrossRef] [EDP Sciences] [Google Scholar]
- Perryman, M. A. C., Brown, A. G. A., Lebreton, Y., et al. 1998, A&A, 331, 81 [NASA ADS] [Google Scholar]
- Reid, I. N., & Gizis, J. E. 1997, AJ, 114, 1992 [NASA ADS] [CrossRef] [Google Scholar]
- Reid, I. N., & Mahoney, S. 2000, MNRAS, 316, 827 [NASA ADS] [CrossRef] [Google Scholar]
- Röser, S., Schilbach, E., Piskunov, A. E., Kharchenko, N. V., & Scholz, R.-D. 2011, A&A, 531, A92 [NASA ADS] [CrossRef] [EDP Sciences] [Google Scholar]
- Rossow, W. B. 1978, Icarus, 36, 1 [NASA ADS] [CrossRef] [Google Scholar]
- Skrutskie, M. F., Cutri, R. M., Stiening, R., et al. 2006, AJ, 131, 1163 [NASA ADS] [CrossRef] [Google Scholar]
- Stern, R. A., Schmitt, J. H. M. M., & Kahabka, P. T. 1995, ApJ, 448, 683 [Google Scholar]
- Tognelli, E., Prada Moroni, P. G., & Degl’Innocenti, S. 2011, A&A, 533, A109 [NASA ADS] [CrossRef] [EDP Sciences] [Google Scholar]
- Tognelli, E., Degl’Innocenti, S., & Prada Moroni, P. G. 2012, A&A, 548, A41 [NASA ADS] [CrossRef] [EDP Sciences] [Google Scholar]
- van Leeuwen, F. 2009, A&A, 497, 209 [NASA ADS] [CrossRef] [EDP Sciences] [Google Scholar]
All Tables
Absolute JHKs(2MASS) photometry and physical parameters of the Hyades single-star sequence members.
All Figures
|
Fig. 1 AstraLux Norte z′-band image of a binary candidate in the Hyades. The image is shown in log scale. |
| In the text | |
|
Fig. 2 J vs. J−Ks (top left panel), J vs. J−H (top right panel) and Ks vs. H−Ks (bottom right panel) color–magnitude diagrams. The Hyades observed single-star sequence is overplotted with theoretical isochrones (630 Myr) from different evolutionary models – PISA (dashed blue line) and DARTMOUTH (solid red line). Synthetic photometry for isochrones are calculated in TA-DA using BT-Settl 2010 synthetic spectra. |
| In the text | |
Current usage metrics show cumulative count of Article Views (full-text article views including HTML views, PDF and ePub downloads, according to the available data) and Abstracts Views on Vision4Press platform.
Data correspond to usage on the plateform after 2015. The current usage metrics is available 48-96 hours after online publication and is updated daily on week days.
Initial download of the metrics may take a while.